29
/de/
de
AIzaSyAYiBZKx7MnpbEhh9jyipgxe19OcubqV5w
April 1, 2024
30970
Europe & Central Asia
ECS
false
2
1
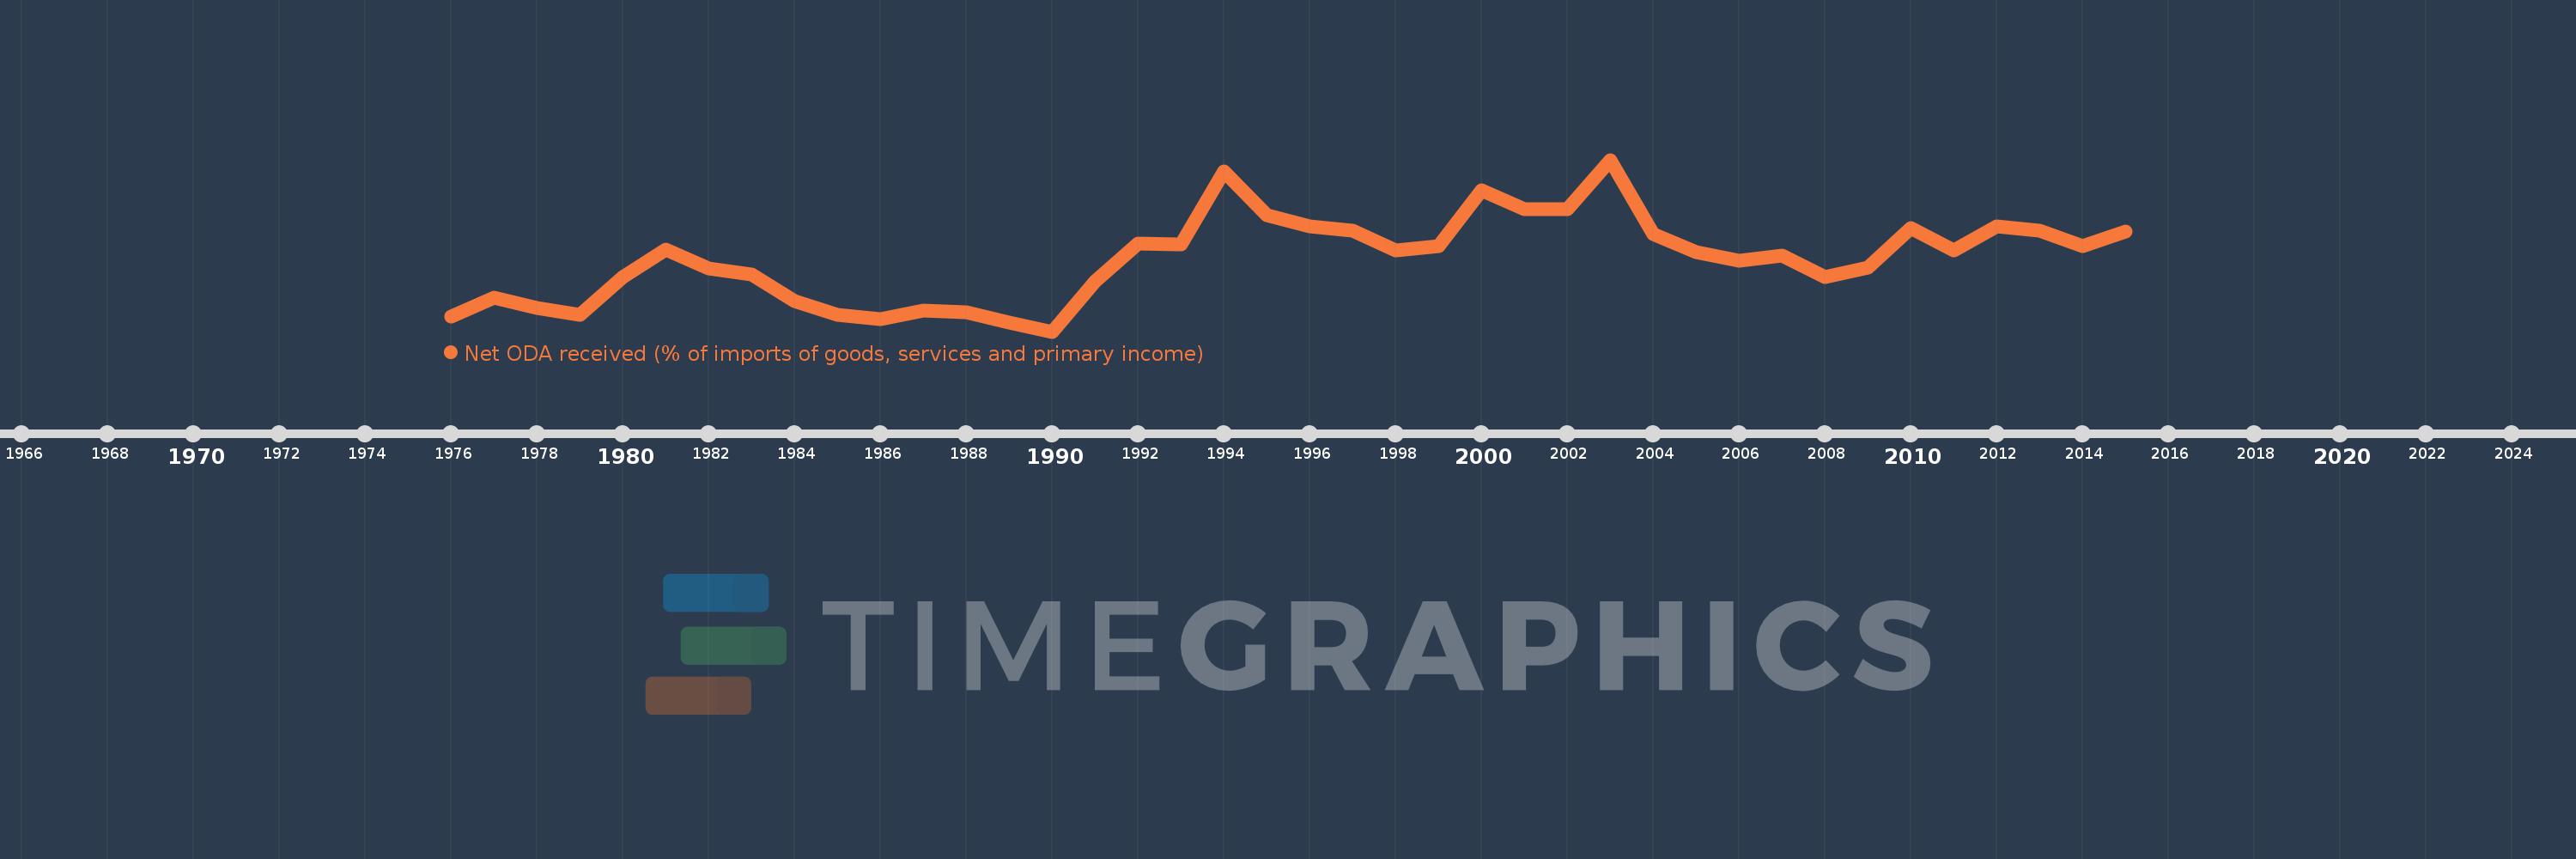
Net ODA received (% of imports of goods, services and primary income)
2015,2014,2013,2012,2011,2010,2009,2008,2007,2006,2005,2004,2003,2002,2001,2000,1999,1998,1997,1996,1995,1994,1993,1992,1991,1990,1989,1988,1987,1986,1985,1984,1983,1982,1981,1980,1979,1978,1977,1976
Diese Statistik in anderen Ländern:
AfghanistanAlbaniaAlgeriaAngolaAntigua and BarbudaArab WorldArgentinaArmeniaArubaAzerbaijanBahamas, TheBahrainBangladeshBarbadosBelarusBelizeBeninBhutanBoliviaBosnia and HerzegovinaBotswanaBrazilBurkina FasoBurundiCabo VerdeCambodiaCameroonCaribbean small statesCentral African RepublicCentral Europe and the BalticsChadChileChinaColombiaComorosCongo, Dem. Rep.Congo, Rep.Costa RicaCote d'IvoireCroatiaCyprusDjiboutiDominicaDominican RepublicEast Asia & PacificEast Asia & Pacific (excluding high income)East Asia & Pacific (IDA & IBRD countries)EcuadorEgypt, Arab Rep.El SalvadorEquatorial GuineaEritreaEthiopiaEuro areaEurope & Central AsiaEurope & Central Asia (excluding high income)Europe & Central Asia (IDA & IBRD countries)European UnionFijiFragile and conflict affected situationsGabonGambia, TheGeorgiaGhanaGrenadaGuatemalaGuineaGuinea-BissauGuyanaHaitiHeavily indebted poor countries (HIPC)High incomeHondurasIBRD onlyIDA & IBRD totalIDA blendIDA onlyIDA totalIndiaIndonesiaIran, Islamic Rep.IraqIsraelJamaicaJordanKazakhstanKenyaKiribatiKorea, Rep.KosovoKuwaitKyrgyz RepublicLao PDRLatin America & Caribbean Latin America & Caribbean (excluding high income)Latin America & the Caribbean (IDA & IBRD countries)Least developed countries: UN classificationLebanonLesothoLiberiaLibyaLow & middle incomeLow incomeLower middle incomeMacedonia, FYRMadagascarMalawiMalaysiaMaldivesMaliMaltaMarshall IslandsMauritaniaMauritiusMexicoMicronesia, Fed. Sts.Middle East & North Africa (excluding high income)Middle East & North Africa (IDA & IBRD countries)Middle incomeMoldovaMongoliaMontenegroMoroccoMozambiqueMyanmarNamibiaNepalNicaraguaNigerNigeriaNorth AmericaOECD membersOmanOther small statesPacific island small statesPakistanPalauPanamaPapua New GuineaParaguayPeruPhilippinesRwandaSamoaSao Tome and PrincipeSaudi ArabiaSenegalSerbiaSeychellesSierra LeoneSingaporeSloveniaSmall statesSolomon IslandsSouth AfricaSouth AsiaSouth Asia (IDA & IBRD)South SudanSri LankaSt. Kitts and NevisSt. LuciaSt. Vincent and the GrenadinesSub-Saharan Africa Sub-Saharan Africa (excluding high income)Sub-Saharan Africa (IDA & IBRD countries)SudanSurinameSwazilandSyrian Arab RepublicTajikistanTanzaniaThailandTimor-LesteTogoTongaTrinidad and TobagoTunisiaTurkeyTuvaluUgandaUkraineUpper middle incomeUruguayVanuatuVenezuela, RBVietnamWest Bank and GazaWorldYemen, Rep.ZambiaZimbabwe Zeitlinie:
Diese Zeitleiste vorliegt die Graphik ab 1976 J. bis 2015 J. Europe & Central Asia. Die Angaben bis 1975 J. sind nicht vorhanden. Die Zahl aktueller Beobachtungen nach Daten: 40.
Die Quelle (Bezeichnung):
Kennzahlen der Weltentwicklung
Die Quelle (Einrichtung):
Development Assistance Committee of the Organisation for Economic Co-operation and Development, Geographical Distribution of Financial Flows to Developing Countries, Development Co-operation Report, and International Development Statistics database. Data are available online at: www.oecd.org/dac/stats/idsonline. World Bank imports of good and services estimates are used for the denominator.
Kategorien:
Aid Effectiveness
Es wurde aktualisiert:
23 Apr 2017 Jahr
Kennzahlen der Wertänderungen vom Jahr zum Jahr
Minimum:
0.014
1 Jan 1990 Jahr
Maximum:
0.15
1 Jan 2003 Jahr
Zum Datum der Beobachtung
Wert
Absolute Veränderung
Die Veränderung bezüglich dem vorherigen Wert
1 Jan 1976 Jahr
0.026
+0.026
0.0%
1 Jan 1977 Jahr
0.041
+0.015
58.33%
1 Jan 1978 Jahr
0.033
-0.008
-20.09%
1 Jan 1979 Jahr
0.027
-0.006
-18.82%
1 Jan 1980 Jahr
0.057
+0.031
114.81%
1 Jan 1981 Jahr
0.079
+0.022
38.5%
1 Jan 1982 Jahr
0.064
-0.016
-20.05%
1 Jan 1983 Jahr
0.059
-0.005
-7.74%
1 Jan 1984 Jahr
0.038
-0.021
-35.78%
1 Jan 1985 Jahr
0.027
-0.011
-27.97%
1 Jan 1986 Jahr
0.024
-0.003
-12.68%
1 Jan 1987 Jahr
0.031
+0.007
30.23%
1 Jan 1988 Jahr
0.029
-0.002
-5.04%
1 Jan 1989 Jahr
0.021
-0.008
-27.33%
1 Jan 1990 Jahr
0.014
-0.007
-35.01%
1 Jan 1991 Jahr
0.054
+0.04
288.22%
1 Jan 1992 Jahr
0.084
+0.03
56.43%
1 Jan 1993 Jahr
0.083
-0.001
-1.02%
1 Jan 1994 Jahr
0.141
+0.058
69.9%
1 Jan 1995 Jahr
0.106
-0.035
-24.73%
1 Jan 1996 Jahr
0.097
-0.009
-8.74%
1 Jan 1997 Jahr
0.094
-0.003
-2.91%
1 Jan 1998 Jahr
0.078
-0.016
-17.02%
1 Jan 1999 Jahr
0.082
+0.004
4.77%
1 Jan 2000 Jahr
0.126
+0.045
54.53%
1 Jan 2001 Jahr
0.111
-0.016
-12.3%
1 Jan 2002 Jahr
0.111
+0.0
0.28%
1 Jan 2003 Jahr
0.15
+0.039
34.73%
1 Jan 2004 Jahr
0.091
-0.059
-39.29%
1 Jan 2005 Jahr
0.077
-0.014
-14.97%
1 Jan 2006 Jahr
0.07
-0.007
-9.6%
1 Jan 2007 Jahr
0.074
+0.004
6.05%
1 Jan 2008 Jahr
0.057
-0.017
-22.97%
1 Jan 2009 Jahr
0.065
+0.007
13.1%
1 Jan 2010 Jahr
0.096
+0.031
48.04%
1 Jan 2011 Jahr
0.078
-0.017
-18.05%
1 Jan 2012 Jahr
0.097
+0.018
23.15%
1 Jan 2013 Jahr
0.094
-0.002
-2.3%
1 Jan 2014 Jahr
0.082
-0.012
-13.11%
1 Jan 2015 Jahr
0.093
+0.011
13.47%
Bewertung der Länder gemäß mit laufender Statistik nach Jahren


Kommentare: