30
/de/
AIzaSyAYiBZKx7MnpbEhh9jyipgxe19OcubqV5w
April 1, 2024
168862
Kiribati
KIR
true
2
1
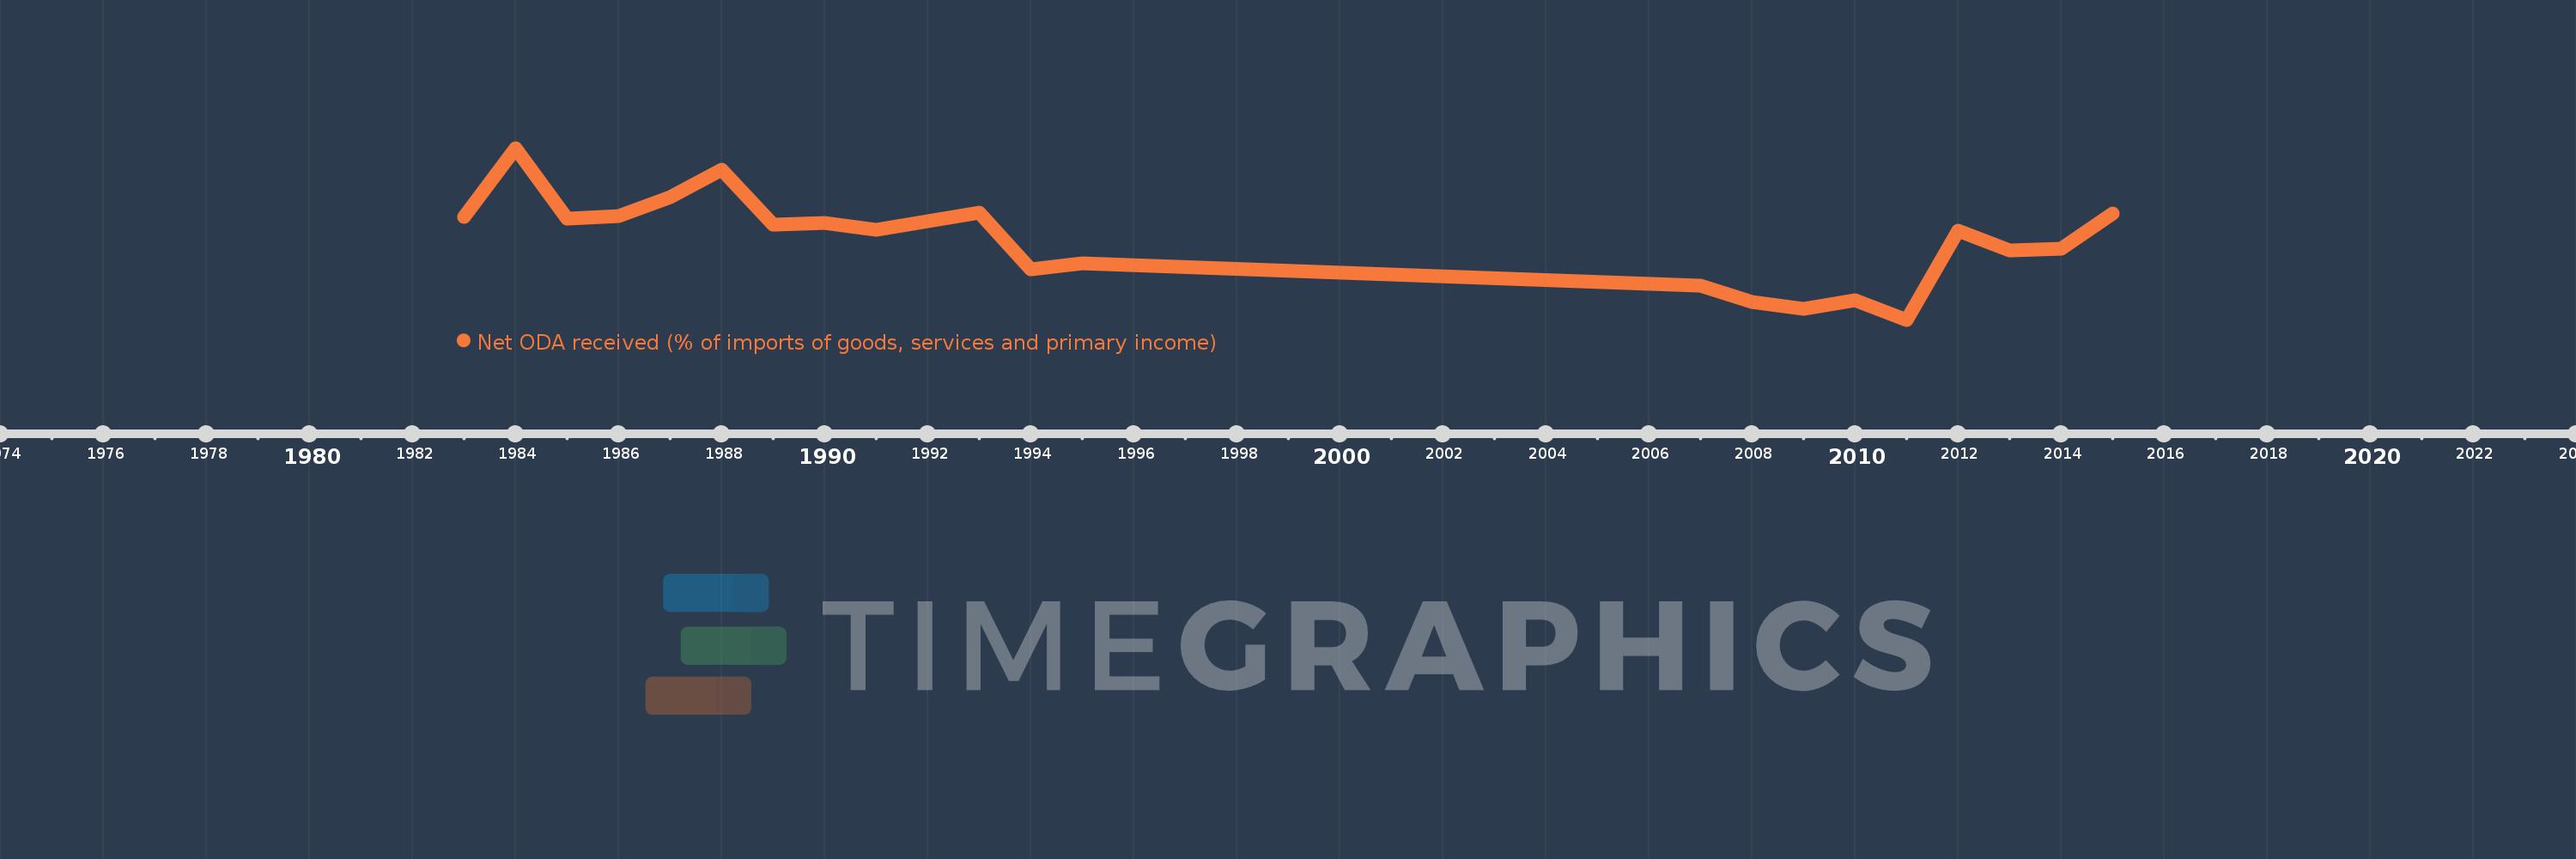
Net ODA received (% of imports of goods, services and primary income)
2015,2014,2013,2012,2011,2010,2009,2008,2007,1995,1994,1993,1992,1991,1990,1989,1988,1987,1986,1985,1984,1983
