29
/de/
de
AIzaSyAYiBZKx7MnpbEhh9jyipgxe19OcubqV5w
April 1, 2024
261299
Tanzania
TZA
true
2
1
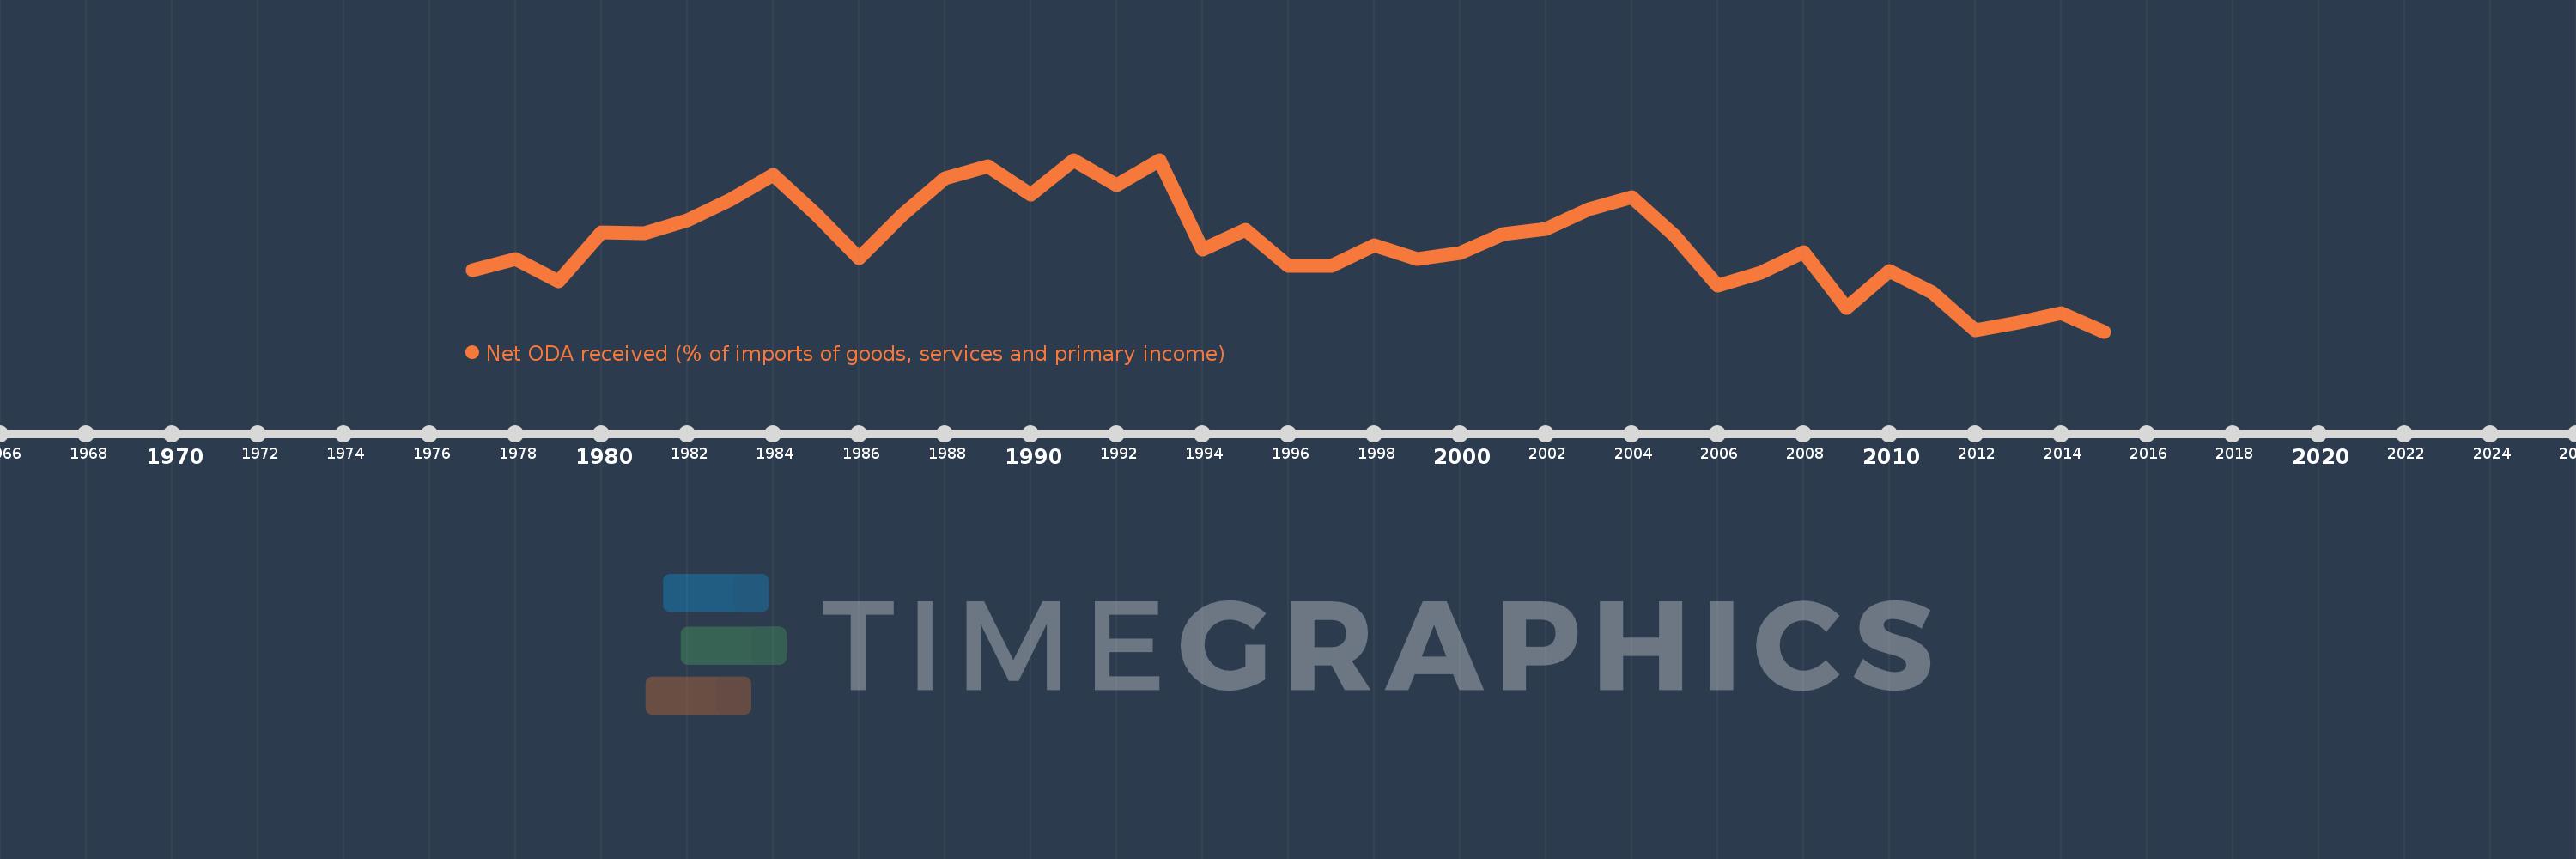
Net ODA received (% of imports of goods, services and primary income)
2015,2014,2013,2012,2011,2010,2009,2008,2007,2006,2005,2004,2003,2002,2001,2000,1999,1998,1997,1996,1995,1994,1993,1992,1991,1990,1989,1988,1987,1986,1985,1984,1983,1982,1981,1980,1979,1978,1977
Diese Statistik in anderen Ländern:
AfghanistanAlbaniaAlgeriaAngolaAntigua and BarbudaArab WorldArgentinaArmeniaArubaAzerbaijanBahamas, TheBahrainBangladeshBarbadosBelarusBelizeBeninBhutanBoliviaBosnia and HerzegovinaBotswanaBrazilBurkina FasoBurundiCabo VerdeCambodiaCameroonCaribbean small statesCentral African RepublicCentral Europe and the BalticsChadChileChinaColombiaComorosCongo, Dem. Rep.Congo, Rep.Costa RicaCote d'IvoireCroatiaCyprusDjiboutiDominicaDominican RepublicEast Asia & PacificEast Asia & Pacific (excluding high income)East Asia & Pacific (IDA & IBRD countries)EcuadorEgypt, Arab Rep.El SalvadorEquatorial GuineaEritreaEthiopiaEuro areaEurope & Central AsiaEurope & Central Asia (excluding high income)Europe & Central Asia (IDA & IBRD countries)European UnionFijiFragile and conflict affected situationsGabonGambia, TheGeorgiaGhanaGrenadaGuatemalaGuineaGuinea-BissauGuyanaHaitiHeavily indebted poor countries (HIPC)High incomeHondurasIBRD onlyIDA & IBRD totalIDA blendIDA onlyIDA totalIndiaIndonesiaIran, Islamic Rep.IraqIsraelJamaicaJordanKazakhstanKenyaKiribatiKorea, Rep.KosovoKuwaitKyrgyz RepublicLao PDRLatin America & Caribbean Latin America & Caribbean (excluding high income)Latin America & the Caribbean (IDA & IBRD countries)Least developed countries: UN classificationLebanonLesothoLiberiaLibyaLow & middle incomeLow incomeLower middle incomeMacedonia, FYRMadagascarMalawiMalaysiaMaldivesMaliMaltaMarshall IslandsMauritaniaMauritiusMexicoMicronesia, Fed. Sts.Middle East & North Africa (excluding high income)Middle East & North Africa (IDA & IBRD countries)Middle incomeMoldovaMongoliaMontenegroMoroccoMozambiqueMyanmarNamibiaNepalNicaraguaNigerNigeriaNorth AmericaOECD membersOmanOther small statesPacific island small statesPakistanPalauPanamaPapua New GuineaParaguayPeruPhilippinesRwandaSamoaSao Tome and PrincipeSaudi ArabiaSenegalSerbiaSeychellesSierra LeoneSingaporeSloveniaSmall statesSolomon IslandsSouth AfricaSouth AsiaSouth Asia (IDA & IBRD)South SudanSri LankaSt. Kitts and NevisSt. LuciaSt. Vincent and the GrenadinesSub-Saharan Africa Sub-Saharan Africa (excluding high income)Sub-Saharan Africa (IDA & IBRD countries)SudanSurinameSwazilandSyrian Arab RepublicTajikistanTanzaniaThailandTimor-LesteTogoTongaTrinidad and TobagoTunisiaTurkeyTuvaluUgandaUkraineUpper middle incomeUruguayVanuatuVenezuela, RBVietnamWest Bank and GazaWorldYemen, Rep.ZambiaZimbabwe Zeitlinie:
Diese Zeitleiste vorliegt die Graphik ab 1977 J. bis 2015 J. Tanzania. Die Angaben bis 1976 J. sind nicht vorhanden. Die Zahl aktueller Beobachtungen nach Daten: 39.
Die Quelle (Bezeichnung):
Kennzahlen der Weltentwicklung
Die Quelle (Einrichtung):
Development Assistance Committee of the Organisation for Economic Co-operation and Development, Geographical Distribution of Financial Flows to Developing Countries, Development Co-operation Report, and International Development Statistics database. Data are available online at: www.oecd.org/dac/stats/idsonline. World Bank imports of good and services estimates are used for the denominator.
Kategorien:
Aid Effectiveness
Es wurde aktualisiert:
23 Apr 2017 Jahr
Kennzahlen der Wertänderungen vom Jahr zum Jahr
Minimum:
18.478
1 Jan 2015 Jahr
Maximum:
69.86
1 Jan 1991 Jahr
Zum Datum der Beobachtung
Wert
Absolute Veränderung
Die Veränderung bezüglich dem vorherigen Wert
1 Jan 1977 Jahr
36.859
+36.859
0.0%
1 Jan 1978 Jahr
40.196
+3.338
9.06%
1 Jan 1979 Jahr
33.416
-6.78
-16.87%
1 Jan 1980 Jahr
48.103
+14.687
43.95%
1 Jan 1981 Jahr
47.86
-0.243
-0.51%
1 Jan 1982 Jahr
51.858
+3.998
8.35%
1 Jan 1983 Jahr
57.893
+6.036
11.64%
1 Jan 1984 Jahr
65.379
+7.486
12.93%
1 Jan 1985 Jahr
53.444
-11.935
-18.26%
1 Jan 1986 Jahr
40.495
-12.949
-24.23%
1 Jan 1987 Jahr
53.222
+12.727
31.43%
1 Jan 1988 Jahr
64.404
+11.182
21.01%
1 Jan 1989 Jahr
67.877
+3.473
5.39%
1 Jan 1990 Jahr
59.466
-8.411
-12.39%
1 Jan 1991 Jahr
69.86
+10.394
17.48%
1 Jan 1992 Jahr
62.294
-7.566
-10.83%
1 Jan 1993 Jahr
69.727
+7.433
11.93%
1 Jan 1994 Jahr
43.049
-26.679
-38.26%
1 Jan 1995 Jahr
49.011
+5.963
13.85%
1 Jan 1996 Jahr
38.181
-10.831
-22.1%
1 Jan 1997 Jahr
38.172
-0.009
-0.02%
1 Jan 1998 Jahr
44.313
+6.142
16.09%
1 Jan 1999 Jahr
40.214
-4.1
-9.25%
1 Jan 2000 Jahr
42.053
+1.839
4.57%
1 Jan 2001 Jahr
47.701
+5.648
13.43%
1 Jan 2002 Jahr
49.278
+1.578
3.31%
1 Jan 2003 Jahr
54.989
+5.71
11.59%
1 Jan 2004 Jahr
58.67
+3.681
6.69%
1 Jan 2005 Jahr
47.023
-11.646
-19.85%
1 Jan 2006 Jahr
32.301
-14.722
-31.31%
1 Jan 2007 Jahr
36.101
+3.8
11.76%
1 Jan 2008 Jahr
42.342
+6.241
17.29%
1 Jan 2009 Jahr
25.589
-16.753
-39.57%
1 Jan 2010 Jahr
36.596
+11.006
43.01%
1 Jan 2011 Jahr
30.193
-6.403
-17.5%
1 Jan 2012 Jahr
18.967
-11.226
-37.18%
1 Jan 2013 Jahr
21.097
+2.13
11.23%
1 Jan 2014 Jahr
23.904
+2.807
13.3%
1 Jan 2015 Jahr
18.478
-5.426
-22.7%
Bewertung der Länder gemäß mit laufender Statistik nach Jahren


Kommentare: