29
/de/
de
AIzaSyAYiBZKx7MnpbEhh9jyipgxe19OcubqV5w
April 1, 2024
107656
Colombia
COL
true
2
1
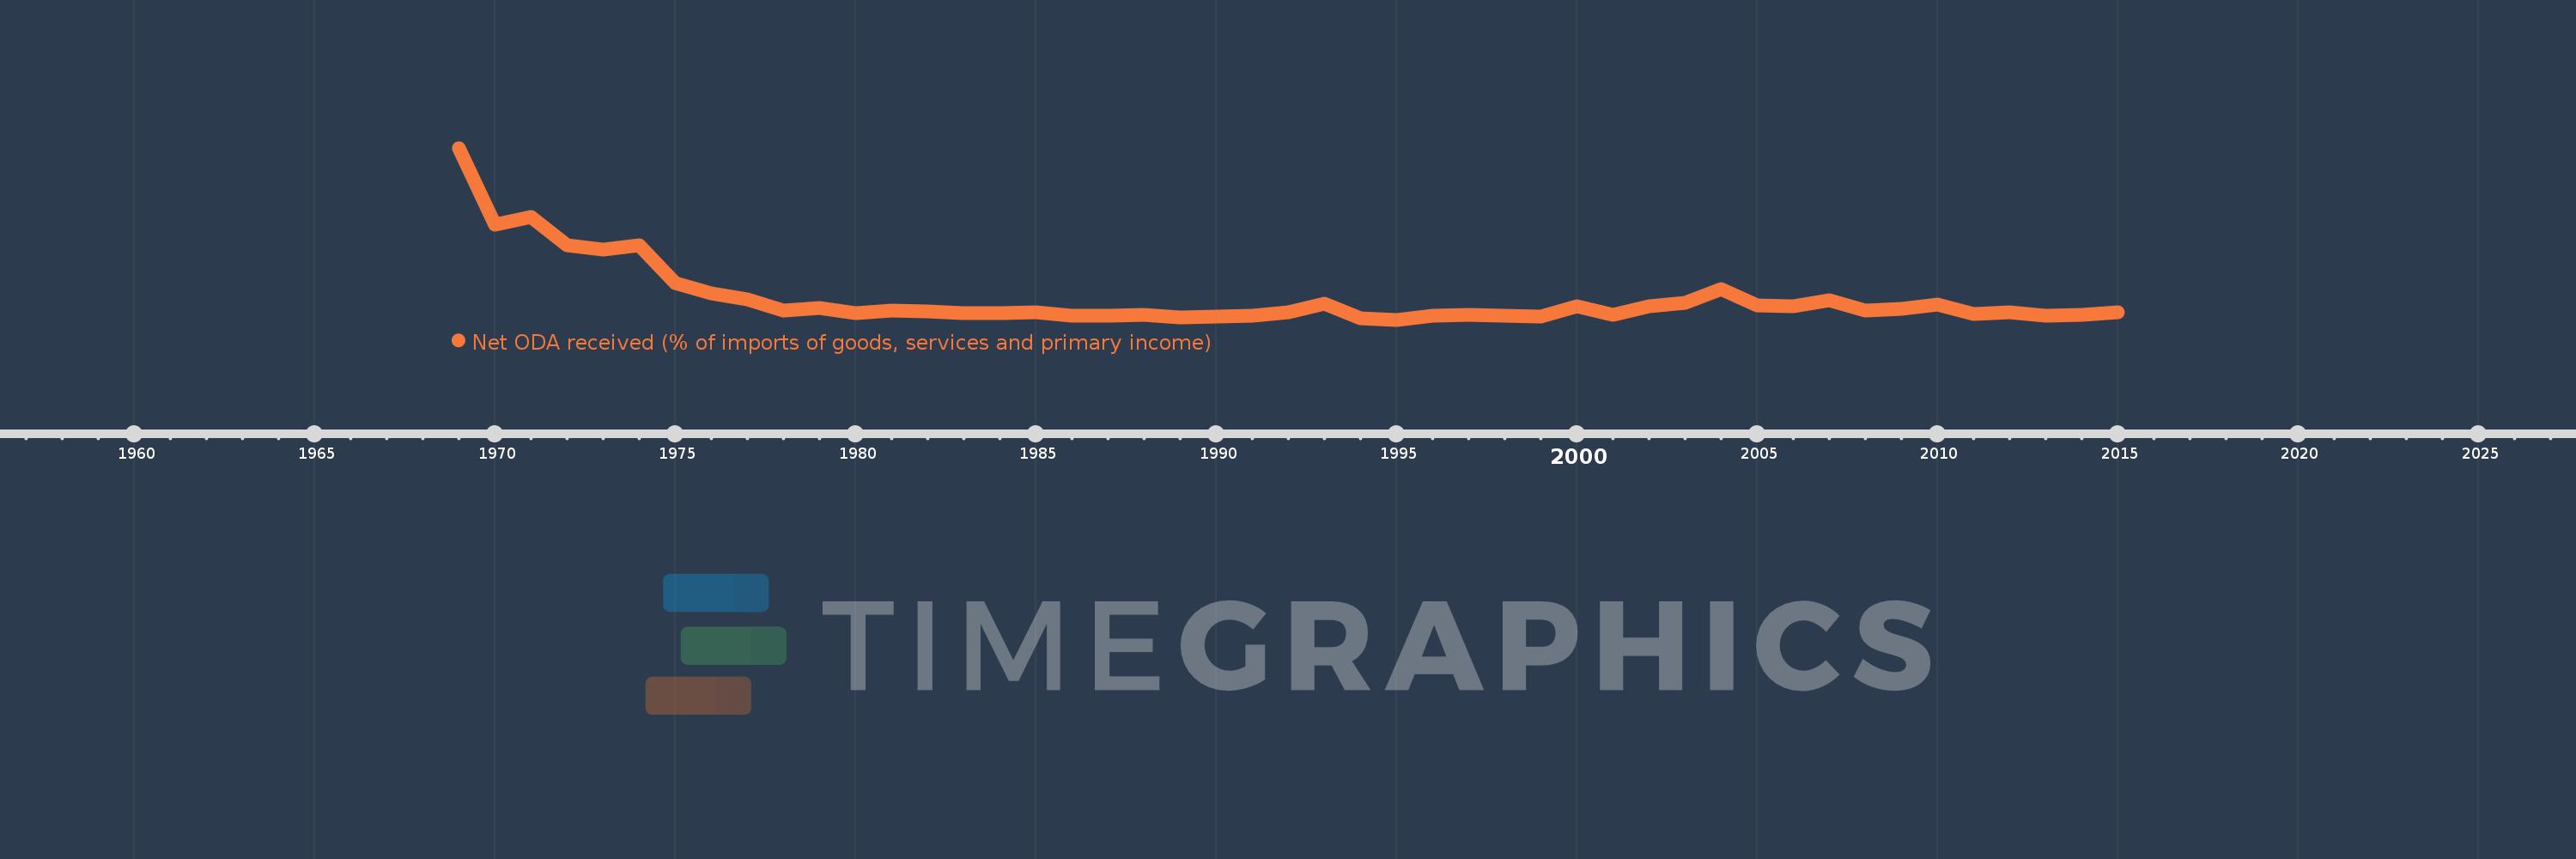
Net ODA received (% of imports of goods, services and primary income)
2015,2014,2013,2012,2011,2010,2009,2008,2007,2006,2005,2004,2003,2002,2001,2000,1999,1998,1997,1996,1995,1994,1993,1992,1991,1990,1989,1988,1987,1986,1985,1984,1983,1982,1981,1980,1979,1978,1977,1976,1975,1974,1973,1972,1971,1970,1969
Diese Statistik in anderen Ländern:
AfghanistanAlbaniaAlgeriaAngolaAntigua and BarbudaArab WorldArgentinaArmeniaArubaAzerbaijanBahamas, TheBahrainBangladeshBarbadosBelarusBelizeBeninBhutanBoliviaBosnia and HerzegovinaBotswanaBrazilBurkina FasoBurundiCabo VerdeCambodiaCameroonCaribbean small statesCentral African RepublicCentral Europe and the BalticsChadChileChinaColombiaComorosCongo, Dem. Rep.Congo, Rep.Costa RicaCote d'IvoireCroatiaCyprusDjiboutiDominicaDominican RepublicEast Asia & PacificEast Asia & Pacific (excluding high income)East Asia & Pacific (IDA & IBRD countries)EcuadorEgypt, Arab Rep.El SalvadorEquatorial GuineaEritreaEthiopiaEuro areaEurope & Central AsiaEurope & Central Asia (excluding high income)Europe & Central Asia (IDA & IBRD countries)European UnionFijiFragile and conflict affected situationsGabonGambia, TheGeorgiaGhanaGrenadaGuatemalaGuineaGuinea-BissauGuyanaHaitiHeavily indebted poor countries (HIPC)High incomeHondurasIBRD onlyIDA & IBRD totalIDA blendIDA onlyIDA totalIndiaIndonesiaIran, Islamic Rep.IraqIsraelJamaicaJordanKazakhstanKenyaKiribatiKorea, Rep.KosovoKuwaitKyrgyz RepublicLao PDRLatin America & Caribbean Latin America & Caribbean (excluding high income)Latin America & the Caribbean (IDA & IBRD countries)Least developed countries: UN classificationLebanonLesothoLiberiaLibyaLow & middle incomeLow incomeLower middle incomeMacedonia, FYRMadagascarMalawiMalaysiaMaldivesMaliMaltaMarshall IslandsMauritaniaMauritiusMexicoMicronesia, Fed. Sts.Middle East & North Africa (excluding high income)Middle East & North Africa (IDA & IBRD countries)Middle incomeMoldovaMongoliaMontenegroMoroccoMozambiqueMyanmarNamibiaNepalNicaraguaNigerNigeriaNorth AmericaOECD membersOmanOther small statesPacific island small statesPakistanPalauPanamaPapua New GuineaParaguayPeruPhilippinesRwandaSamoaSao Tome and PrincipeSaudi ArabiaSenegalSerbiaSeychellesSierra LeoneSingaporeSloveniaSmall statesSolomon IslandsSouth AfricaSouth AsiaSouth Asia (IDA & IBRD)South SudanSri LankaSt. Kitts and NevisSt. LuciaSt. Vincent and the GrenadinesSub-Saharan Africa Sub-Saharan Africa (excluding high income)Sub-Saharan Africa (IDA & IBRD countries)SudanSurinameSwazilandSyrian Arab RepublicTajikistanTanzaniaThailandTimor-LesteTogoTongaTrinidad and TobagoTunisiaTurkeyTuvaluUgandaUkraineUpper middle incomeUruguayVanuatuVenezuela, RBVietnamWest Bank and GazaWorldYemen, Rep.ZambiaZimbabwe Zeitlinie:
Diese Zeitleiste vorliegt die Graphik ab 1969 J. bis 2015 J. Colombia. Die Angaben bis 1968 J. sind nicht vorhanden. Die Zahl aktueller Beobachtungen nach Daten: 47.
Die Quelle (Bezeichnung):
Kennzahlen der Weltentwicklung
Die Quelle (Einrichtung):
Development Assistance Committee of the Organisation for Economic Co-operation and Development, Geographical Distribution of Financial Flows to Developing Countries, Development Co-operation Report, and International Development Statistics database. Data are available online at: www.oecd.org/dac/stats/idsonline. World Bank imports of good and services estimates are used for the denominator.
Kategorien:
Aid Effectiveness
Es wurde aktualisiert:
23 Apr 2017 Jahr
Kennzahlen der Wertänderungen vom Jahr zum Jahr
Minimum:
0.464
1 Jan 1995 Jahr
Maximum:
19.534
1 Jan 1969 Jahr
Zum Datum der Beobachtung
Wert
Absolute Veränderung
Die Veränderung bezüglich dem vorherigen Wert
1 Jan 1969 Jahr
19.534
+19.534
0.0%
1 Jan 1970 Jahr
11.053
-8.481
-43.42%
1 Jan 1971 Jahr
11.861
+0.808
7.31%
1 Jan 1972 Jahr
8.739
-3.122
-26.32%
1 Jan 1973 Jahr
8.223
-0.516
-5.91%
1 Jan 1974 Jahr
8.778
+0.555
6.75%
1 Jan 1975 Jahr
4.528
-4.25
-48.42%
1 Jan 1976 Jahr
3.438
-1.09
-24.08%
1 Jan 1977 Jahr
2.743
-0.695
-20.21%
1 Jan 1978 Jahr
1.523
-1.22
-44.49%
1 Jan 1979 Jahr
1.806
+0.283
18.57%
1 Jan 1980 Jahr
1.19
-0.615
-34.09%
1 Jan 1981 Jahr
1.441
+0.251
21.12%
1 Jan 1982 Jahr
1.403
-0.039
-2.7%
1 Jan 1983 Jahr
1.17
-0.232
-16.56%
1 Jan 1984 Jahr
1.175
+0.005
0.4%
1 Jan 1985 Jahr
1.246
+0.071
6.07%
1 Jan 1986 Jahr
0.887
-0.359
-28.84%
1 Jan 1987 Jahr
0.897
+0.01
1.1%
1 Jan 1988 Jahr
1.007
+0.11
12.25%
1 Jan 1989 Jahr
0.763
-0.243
-24.17%
1 Jan 1990 Jahr
0.774
+0.01
1.37%
1 Jan 1991 Jahr
0.931
+0.157
20.32%
1 Jan 1992 Jahr
1.283
+0.352
37.78%
1 Jan 1993 Jahr
2.2
+0.917
71.52%
1 Jan 1994 Jahr
0.607
-1.593
-72.42%
1 Jan 1995 Jahr
0.464
-0.143
-23.59%
1 Jan 1996 Jahr
0.925
+0.461
99.5%
1 Jan 1997 Jahr
0.973
+0.048
5.19%
1 Jan 1998 Jahr
0.899
-0.074
-7.63%
1 Jan 1999 Jahr
0.837
-0.062
-6.85%
1 Jan 2000 Jahr
1.928
+1.09
130.25%
1 Jan 2001 Jahr
1.052
-0.876
-45.43%
1 Jan 2002 Jahr
1.986
+0.934
88.78%
1 Jan 2003 Jahr
2.319
+0.333
16.75%
1 Jan 2004 Jahr
3.903
+1.585
68.34%
1 Jan 2005 Jahr
2.074
-1.829
-46.86%
1 Jan 2006 Jahr
1.954
-0.121
-5.82%
1 Jan 2007 Jahr
2.637
+0.684
34.99%
1 Jan 2008 Jahr
1.518
-1.12
-42.45%
1 Jan 2009 Jahr
1.708
+0.19
12.51%
1 Jan 2010 Jahr
2.146
+0.438
25.67%
1 Jan 2011 Jahr
1.112
-1.034
-48.17%
1 Jan 2012 Jahr
1.248
+0.136
12.2%
1 Jan 2013 Jahr
0.87
-0.378
-30.3%
1 Jan 2014 Jahr
0.975
+0.105
12.06%
1 Jan 2015 Jahr
1.331
+0.357
36.6%
Bewertung der Länder gemäß mit laufender Statistik nach Jahren


Kommentare: