29
/de/
de
AIzaSyAYiBZKx7MnpbEhh9jyipgxe19OcubqV5w
April 1, 2024
174485
Lao PDR
LAO
true
2
1
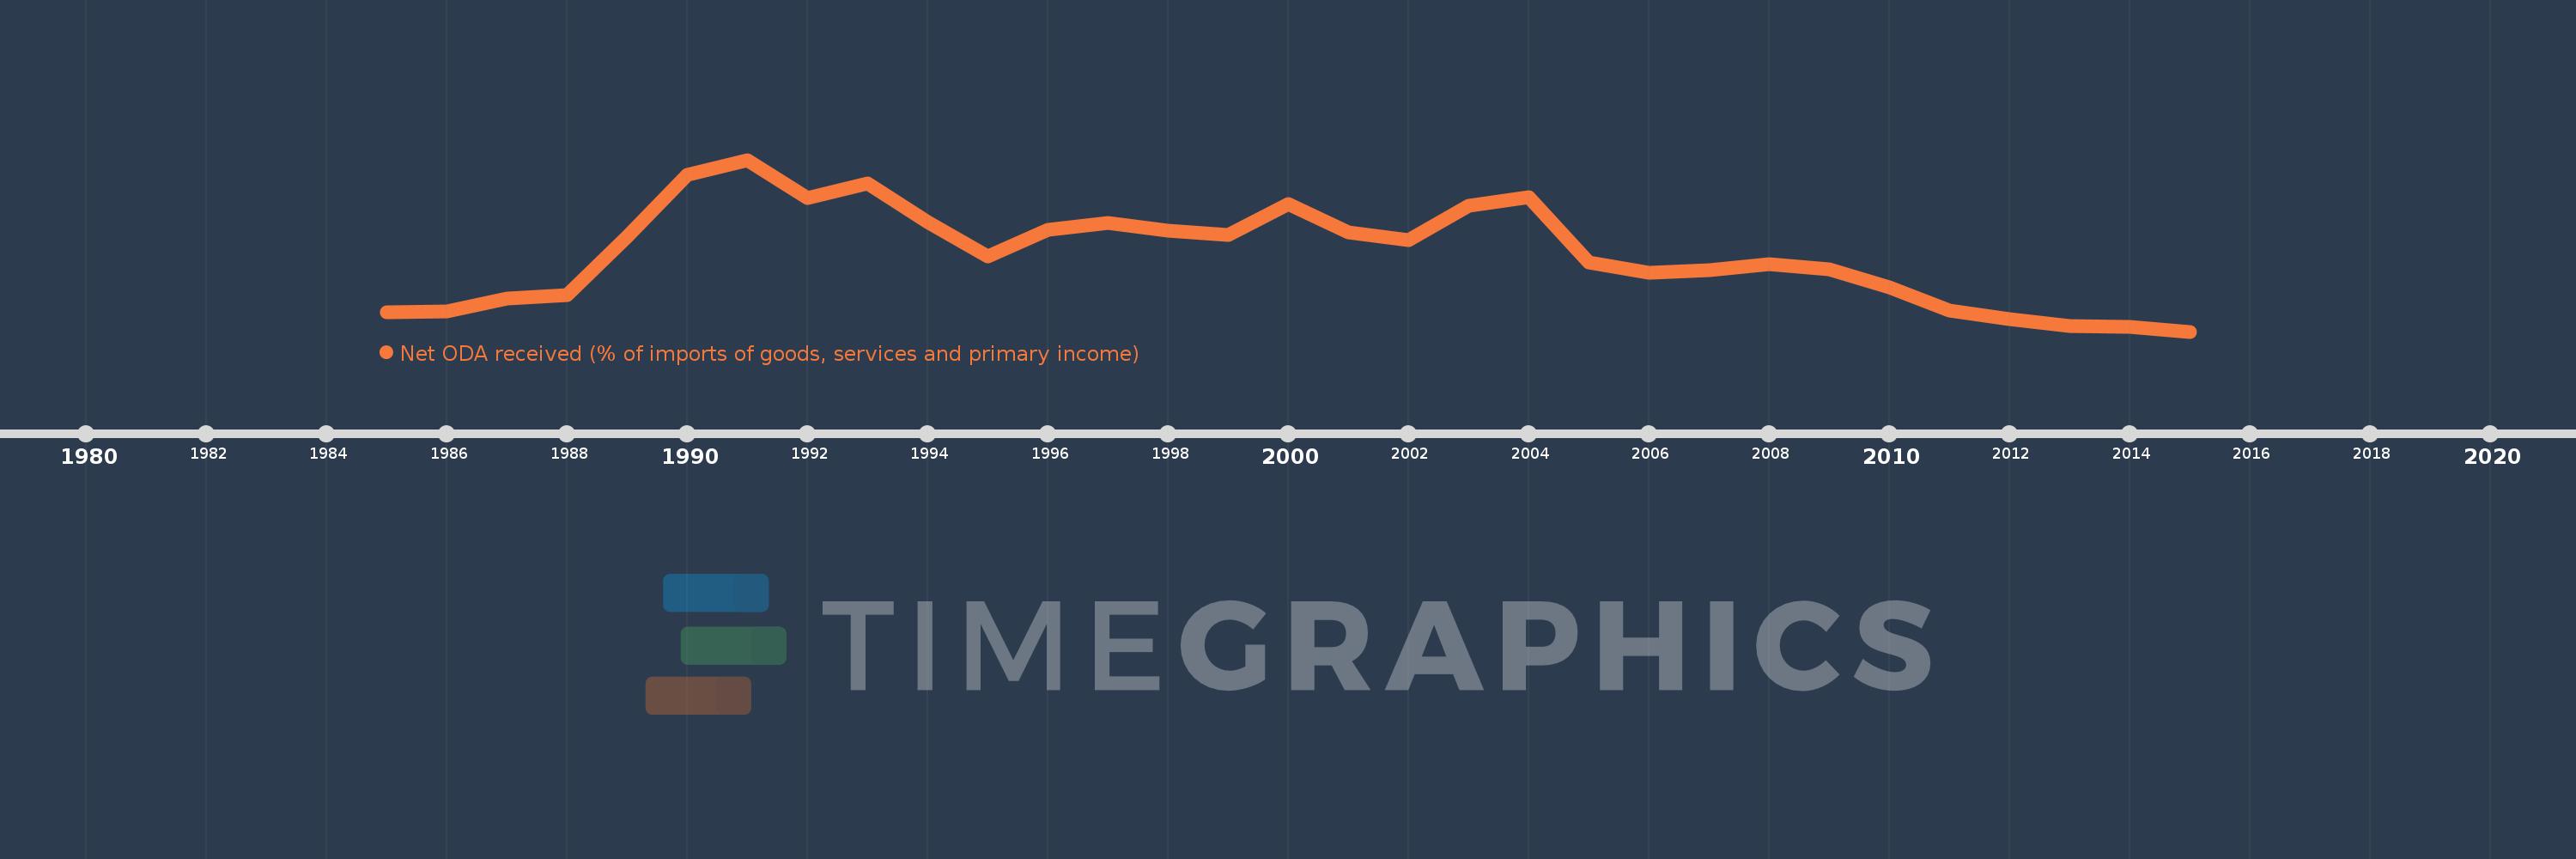
Net ODA received (% of imports of goods, services and primary income)
2015,2014,2013,2012,2011,2010,2009,2008,2007,2006,2005,2004,2003,2002,2001,2000,1999,1998,1997,1996,1995,1994,1993,1992,1991,1990,1989,1988,1987,1986,1985
Diese Statistik in anderen Ländern:
AfghanistanAlbaniaAlgeriaAngolaAntigua and BarbudaArab WorldArgentinaArmeniaArubaAzerbaijanBahamas, TheBahrainBangladeshBarbadosBelarusBelizeBeninBhutanBoliviaBosnia and HerzegovinaBotswanaBrazilBurkina FasoBurundiCabo VerdeCambodiaCameroonCaribbean small statesCentral African RepublicCentral Europe and the BalticsChadChileChinaColombiaComorosCongo, Dem. Rep.Congo, Rep.Costa RicaCote d'IvoireCroatiaCyprusDjiboutiDominicaDominican RepublicEast Asia & PacificEast Asia & Pacific (excluding high income)East Asia & Pacific (IDA & IBRD countries)EcuadorEgypt, Arab Rep.El SalvadorEquatorial GuineaEritreaEthiopiaEuro areaEurope & Central AsiaEurope & Central Asia (excluding high income)Europe & Central Asia (IDA & IBRD countries)European UnionFijiFragile and conflict affected situationsGabonGambia, TheGeorgiaGhanaGrenadaGuatemalaGuineaGuinea-BissauGuyanaHaitiHeavily indebted poor countries (HIPC)High incomeHondurasIBRD onlyIDA & IBRD totalIDA blendIDA onlyIDA totalIndiaIndonesiaIran, Islamic Rep.IraqIsraelJamaicaJordanKazakhstanKenyaKiribatiKorea, Rep.KosovoKuwaitKyrgyz RepublicLao PDRLatin America & Caribbean Latin America & Caribbean (excluding high income)Latin America & the Caribbean (IDA & IBRD countries)Least developed countries: UN classificationLebanonLesothoLiberiaLibyaLow & middle incomeLow incomeLower middle incomeMacedonia, FYRMadagascarMalawiMalaysiaMaldivesMaliMaltaMarshall IslandsMauritaniaMauritiusMexicoMicronesia, Fed. Sts.Middle East & North Africa (excluding high income)Middle East & North Africa (IDA & IBRD countries)Middle incomeMoldovaMongoliaMontenegroMoroccoMozambiqueMyanmarNamibiaNepalNicaraguaNigerNigeriaNorth AmericaOECD membersOmanOther small statesPacific island small statesPakistanPalauPanamaPapua New GuineaParaguayPeruPhilippinesRwandaSamoaSao Tome and PrincipeSaudi ArabiaSenegalSerbiaSeychellesSierra LeoneSingaporeSloveniaSmall statesSolomon IslandsSouth AfricaSouth AsiaSouth Asia (IDA & IBRD)South SudanSri LankaSt. Kitts and NevisSt. LuciaSt. Vincent and the GrenadinesSub-Saharan Africa Sub-Saharan Africa (excluding high income)Sub-Saharan Africa (IDA & IBRD countries)SudanSurinameSwazilandSyrian Arab RepublicTajikistanTanzaniaThailandTimor-LesteTogoTongaTrinidad and TobagoTunisiaTurkeyTuvaluUgandaUkraineUpper middle incomeUruguayVanuatuVenezuela, RBVietnamWest Bank and GazaWorldYemen, Rep.ZambiaZimbabwe Zeitlinie:
Diese Zeitleiste vorliegt die Graphik ab 1985 J. bis 2015 J. Lao PDR. Die Angaben bis 1984 J. sind nicht vorhanden. Die Zahl aktueller Beobachtungen nach Daten: 31.
Die Quelle (Bezeichnung):
Kennzahlen der Weltentwicklung
Die Quelle (Einrichtung):
Development Assistance Committee of the Organisation for Economic Co-operation and Development, Geographical Distribution of Financial Flows to Developing Countries, Development Co-operation Report, and International Development Statistics database. Data are available online at: www.oecd.org/dac/stats/idsonline. World Bank imports of good and services estimates are used for the denominator.
Kategorien:
Aid Effectiveness
Es wurde aktualisiert:
23 Apr 2017 Jahr
Kennzahlen der Wertänderungen vom Jahr zum Jahr
Minimum:
9.562
1 Jan 2015 Jahr
Maximum:
69.303
1 Jan 1991 Jahr
Zum Datum der Beobachtung
Wert
Absolute Veränderung
Die Veränderung bezüglich dem vorherigen Wert
1 Jan 1985 Jahr
16.171
+16.171
0.0%
1 Jan 1986 Jahr
16.629
+0.458
2.83%
1 Jan 1987 Jahr
21.127
+4.498
27.05%
1 Jan 1988 Jahr
22.405
+1.278
6.05%
1 Jan 1989 Jahr
42.452
+20.047
89.48%
1 Jan 1990 Jahr
64.207
+21.755
51.25%
1 Jan 1991 Jahr
69.303
+5.095
7.94%
1 Jan 1992 Jahr
55.922
-13.38
-19.31%
1 Jan 1993 Jahr
61.074
+5.152
9.21%
1 Jan 1994 Jahr
47.536
-13.538
-22.17%
1 Jan 1995 Jahr
35.611
-11.925
-25.09%
1 Jan 1996 Jahr
45.021
+9.41
26.43%
1 Jan 1997 Jahr
47.206
+2.185
4.85%
1 Jan 1998 Jahr
44.567
-2.639
-5.59%
1 Jan 1999 Jahr
43.151
-1.416
-3.18%
1 Jan 2000 Jahr
53.922
+10.771
24.96%
1 Jan 2001 Jahr
43.987
-9.935
-18.42%
1 Jan 2002 Jahr
41.325
-2.662
-6.05%
1 Jan 2003 Jahr
53.42
+12.095
29.27%
1 Jan 2004 Jahr
56.173
+2.753
5.15%
1 Jan 2005 Jahr
33.614
-22.559
-40.16%
1 Jan 2006 Jahr
30.095
-3.519
-10.47%
1 Jan 2007 Jahr
31.006
+0.911
3.03%
1 Jan 2008 Jahr
32.943
+1.937
6.25%
1 Jan 2009 Jahr
31.193
-1.75
-5.31%
1 Jan 2010 Jahr
24.858
-6.335
-20.31%
1 Jan 2011 Jahr
16.84
-8.018
-32.25%
1 Jan 2012 Jahr
13.812
-3.029
-17.99%
1 Jan 2013 Jahr
11.414
-2.397
-17.36%
1 Jan 2014 Jahr
11.283
-0.131
-1.15%
1 Jan 2015 Jahr
9.562
-1.722
-15.26%
Bewertung der Länder gemäß mit laufender Statistik nach Jahren


Kommentare: