29
/de/
de
AIzaSyAYiBZKx7MnpbEhh9jyipgxe19OcubqV5w
April 1, 2024
275414
United Kingdom
GBR
true
2
1
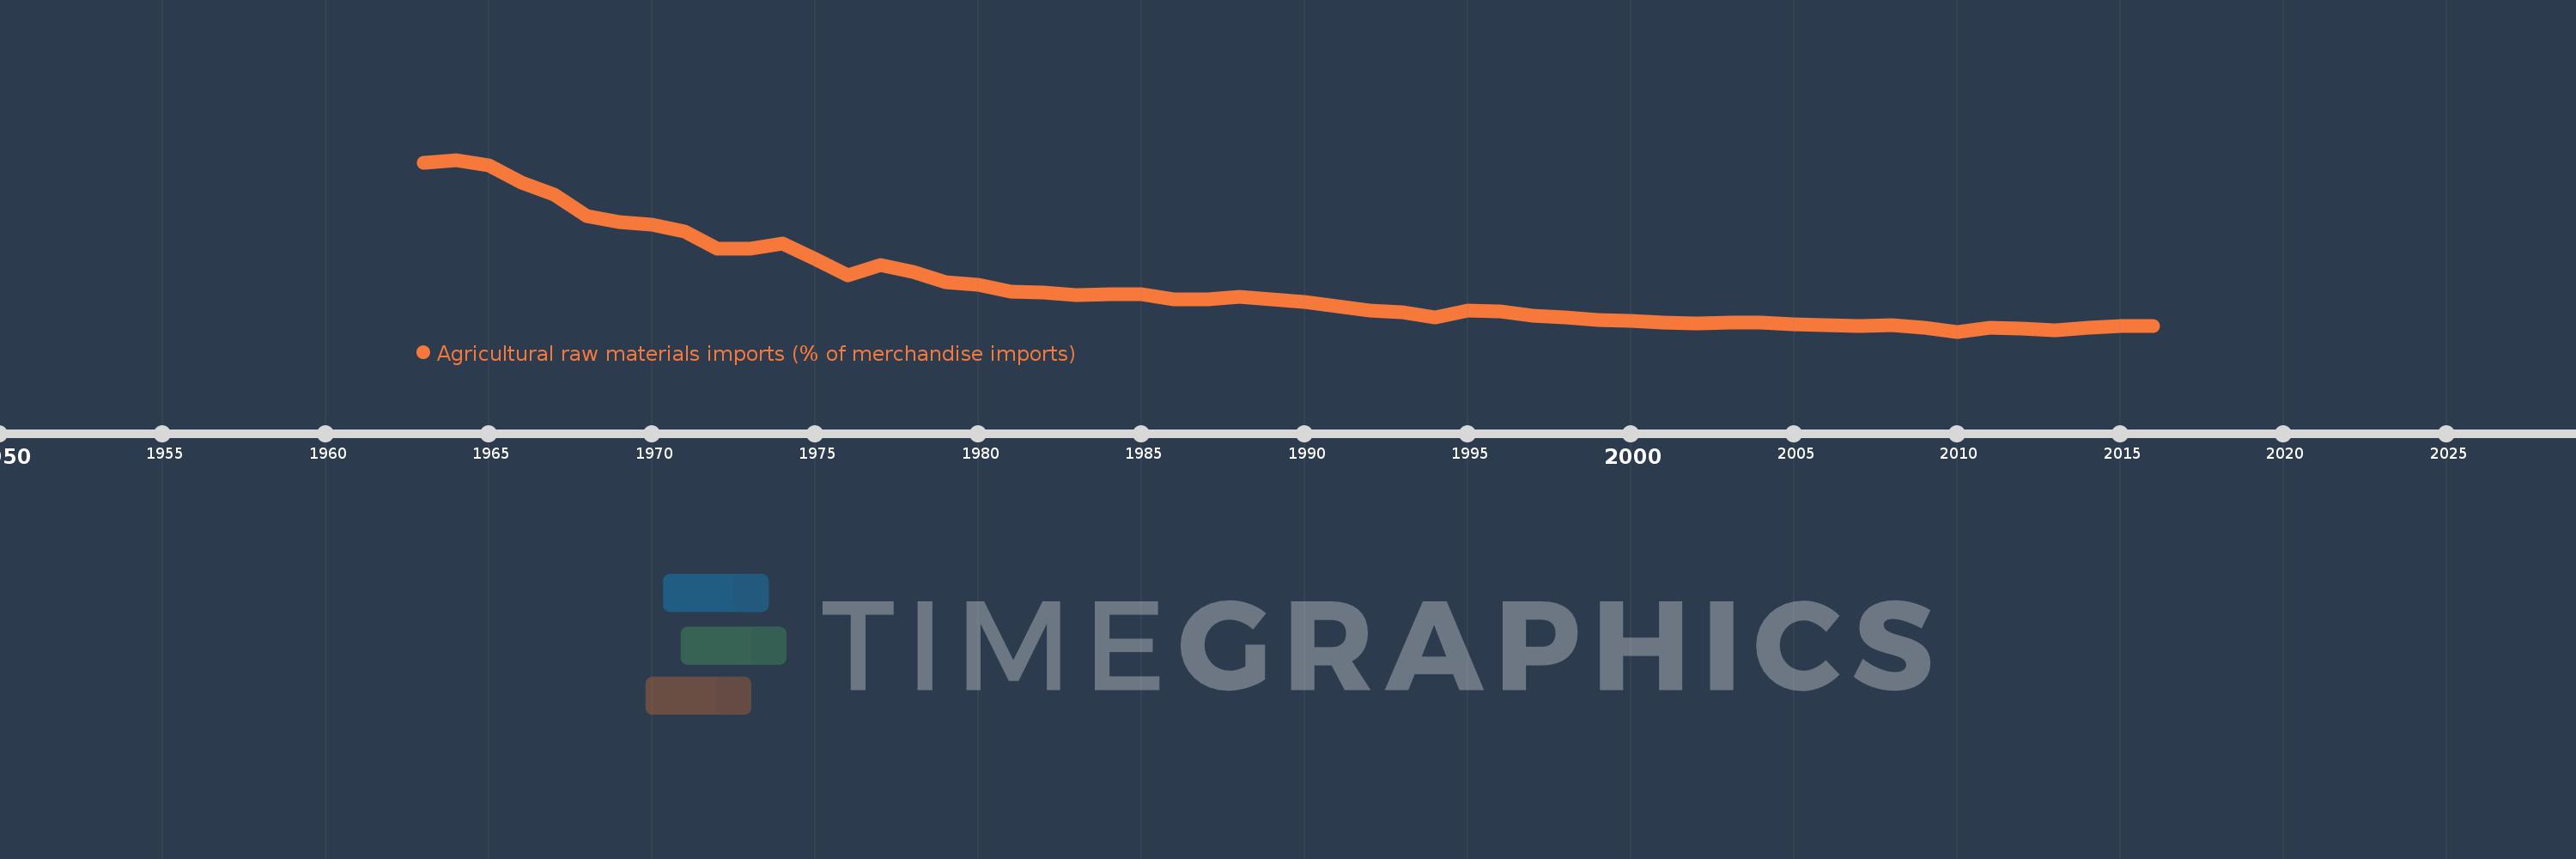
Agricultural raw materials imports (% of merchandise imports)
2016,2015,2014,2013,2012,2011,2010,2009,2008,2007,2006,2005,2004,2003,2002,2001,2000,1999,1998,1997,1996,1995,1994,1993,1992,1991,1990,1989,1988,1987,1986,1985,1984,1983,1982,1981,1980,1979,1978,1977,1976,1975,1974,1973,1972,1971,1970,1969,1968,1967,1966,1965,1964,1963
Diese Statistik in anderen Ländern:
AfghanistanAlbaniaAlgeriaAndorraAngolaAntigua and BarbudaArab WorldArgentinaArmeniaArubaAustraliaAustriaAzerbaijanBahamas, TheBahrainBangladeshBarbadosBelarusBelgiumBelizeBeninBermudaBhutanBoliviaBosnia and HerzegovinaBotswanaBrazilBrunei DarussalamBulgariaBurkina FasoBurundiCabo VerdeCambodiaCameroonCanadaCaribbean small statesCayman IslandsCentral African RepublicCentral Europe and the BalticsChadChileChinaColombiaComorosCongo, Dem. Rep.Congo, Rep.Costa RicaCote d'IvoireCroatiaCubaCyprusCzech RepublicDenmarkDjiboutiDominicaDominican RepublicEarly-demographic dividendEast Asia & PacificEast Asia & Pacific (excluding high income)East Asia & Pacific (IDA & IBRD countries)EcuadorEgypt, Arab Rep.El SalvadorEquatorial GuineaEritreaEstoniaEthiopiaEuro areaEurope & Central AsiaEurope & Central Asia (excluding high income)Europe & Central Asia (IDA & IBRD countries)European UnionFaroe IslandsFijiFinlandFragile and conflict affected situationsFranceFrench PolynesiaGabonGambia, TheGeorgiaGermanyGhanaGreeceGreenlandGrenadaGuatemalaGuineaGuinea-BissauGuyanaHaitiHeavily indebted poor countries (HIPC)High incomeHondurasHong Kong SAR, ChinaHungaryIBRD onlyIcelandIDA & IBRD totalIDA blendIDA onlyIDA totalIndiaIndonesiaIran, Islamic Rep.IraqIrelandIsraelItalyJamaicaJapanJordanKazakhstanKenyaKiribatiKorea, Rep.KuwaitKyrgyz RepublicLao PDRLate-demographic dividendLatin America & Caribbean Latin America & Caribbean (excluding high income)Latin America & the Caribbean (IDA & IBRD countries)LatviaLeast developed countries: UN classificationLebanonLesothoLiberiaLibyaLithuaniaLow & middle incomeLow incomeLower middle incomeLuxembourgMacao SAR, ChinaMacedonia, FYRMadagascarMalawiMalaysiaMaldivesMaliMaltaMauritaniaMauritiusMexicoMiddle East & North AfricaMiddle East & North Africa (excluding high income)Middle East & North Africa (IDA & IBRD countries)Middle incomeMoldovaMongoliaMoroccoMozambiqueMyanmarNamibiaNepalNetherlandsNew CaledoniaNew ZealandNicaraguaNigerNigeriaNorth AmericaNorwayOECD membersOmanOther small statesPacific island small statesPakistanPalauPanamaPapua New GuineaParaguayPeruPhilippinesPolandPortugalPost-demographic dividendPre-demographic dividendQatarRomaniaRussian FederationRwandaSamoaSao Tome and PrincipeSaudi ArabiaSenegalSerbiaSeychellesSierra LeoneSingaporeSlovak RepublicSloveniaSmall statesSolomon IslandsSomaliaSouth AfricaSouth AsiaSouth Asia (IDA & IBRD)SpainSri LankaSt. Kitts and NevisSt. LuciaSt. Vincent and the GrenadinesSub-Saharan Africa Sub-Saharan Africa (excluding high income)Sub-Saharan Africa (IDA & IBRD countries)SudanSurinameSwazilandSwedenSwitzerlandSyrian Arab RepublicTajikistanTanzaniaThailandTimor-LesteTogoTongaTrinidad and TobagoTunisiaTurkeyTurkmenistanTurks and Caicos IslandsTuvaluUgandaUkraineUnited Arab EmiratesUnited KingdomUnited StatesUpper middle incomeUruguayVanuatuVenezuela, RBVietnamVirgin Islands (U.S.)WorldYemen, Rep.ZambiaZimbabwe Zeitlinie:
Diese Zeitleiste vorliegt die Graphik ab 1963 J. bis 2016 J. United Kingdom. Die Angaben bis 1962 J. sind nicht vorhanden. Die Zahl aktueller Beobachtungen nach Daten: 54.
Die Quelle (Bezeichnung):
Kennzahlen der Weltentwicklung
Die Quelle (Einrichtung):
World Bank staff estimates from the Comtrade database maintained by the United Nations Statistics Division.
Kategorien:
Agriculture & Rural Development, Private Sector, Trade
Es wurde aktualisiert:
23 Apr 2017 Jahr
Kennzahlen der Wertänderungen vom Jahr zum Jahr
Minimum:
0.829
1 Jan 2010 Jahr
Maximum:
14.762
1 Jan 1964 Jahr
Zum Datum der Beobachtung
Wert
Absolute Veränderung
Die Veränderung bezüglich dem vorherigen Wert
1 Jan 1963 Jahr
14.536
+14.536
0.0%
1 Jan 1964 Jahr
14.762
+0.226
1.55%
1 Jan 1965 Jahr
14.287
-0.475
-3.22%
1 Jan 1966 Jahr
12.928
-1.359
-9.51%
1 Jan 1967 Jahr
11.924
-1.004
-7.76%
1 Jan 1968 Jahr
10.227
-1.697
-14.24%
1 Jan 1969 Jahr
9.741
-0.486
-4.75%
1 Jan 1970 Jahr
9.48
-0.261
-2.68%
1 Jan 1971 Jahr
8.943
-0.537
-5.67%
1 Jan 1972 Jahr
7.563
-1.38
-15.44%
1 Jan 1973 Jahr
7.528
-0.035
-0.46%
1 Jan 1974 Jahr
7.954
+0.426
5.66%
1 Jan 1975 Jahr
6.69
-1.264
-15.89%
1 Jan 1976 Jahr
5.362
-1.328
-19.86%
1 Jan 1977 Jahr
6.2
+0.838
15.63%
1 Jan 1978 Jahr
5.688
-0.512
-8.26%
1 Jan 1979 Jahr
4.82
-0.868
-15.26%
1 Jan 1980 Jahr
4.614
-0.206
-4.28%
1 Jan 1981 Jahr
4.071
-0.542
-11.76%
1 Jan 1982 Jahr
3.979
-0.092
-2.27%
1 Jan 1983 Jahr
3.761
-0.218
-5.48%
1 Jan 1984 Jahr
3.853
+0.092
2.46%
1 Jan 1985 Jahr
3.841
-0.012
-0.32%
1 Jan 1986 Jahr
3.441
-0.4
-10.41%
1 Jan 1987 Jahr
3.407
-0.034
-0.98%
1 Jan 1988 Jahr
3.663
+0.255
7.5%
1 Jan 1989 Jahr
3.437
-0.226
-6.16%
1 Jan 1990 Jahr
3.225
-0.212
-6.18%
1 Jan 1991 Jahr
2.874
-0.351
-10.87%
1 Jan 1992 Jahr
2.531
-0.343
-11.94%
1 Jan 1993 Jahr
2.391
-0.14
-5.54%
1 Jan 1994 Jahr
2.005
-0.386
-16.15%
1 Jan 1995 Jahr
2.505
+0.501
24.98%
1 Jan 1996 Jahr
2.434
-0.072
-2.86%
1 Jan 1997 Jahr
2.091
-0.342
-14.06%
1 Jan 1998 Jahr
2.005
-0.086
-4.12%
1 Jan 1999 Jahr
1.768
-0.238
-11.85%
1 Jan 2000 Jahr
1.678
-0.09
-5.1%
1 Jan 2001 Jahr
1.547
-0.13
-7.77%
1 Jan 2002 Jahr
1.474
-0.073
-4.73%
1 Jan 2003 Jahr
1.56
+0.086
5.85%
1 Jan 2004 Jahr
1.546
-0.014
-0.91%
1 Jan 2005 Jahr
1.454
-0.092
-5.95%
1 Jan 2006 Jahr
1.385
-0.069
-4.72%
1 Jan 2007 Jahr
1.257
-0.128
-9.24%
1 Jan 2008 Jahr
1.32
+0.063
5.0%
1 Jan 2009 Jahr
1.123
-0.197
-14.91%
1 Jan 2010 Jahr
0.829
-0.294
-26.19%
1 Jan 2011 Jahr
1.142
+0.313
37.72%
1 Jan 2012 Jahr
1.093
-0.049
-4.3%
1 Jan 2013 Jahr
0.967
-0.125
-11.46%
1 Jan 2014 Jahr
1.166
+0.199
20.54%
1 Jan 2015 Jahr
1.27
+0.104
8.89%
1 Jan 2016 Jahr
1.29
+0.02
1.57%
Bewertung der Länder gemäß mit laufender Statistik nach Jahren


Kommentare: