29
/de/
de
AIzaSyAYiBZKx7MnpbEhh9jyipgxe19OcubqV5w
April 1, 2024
138993
Germany
DEU
true
2
1
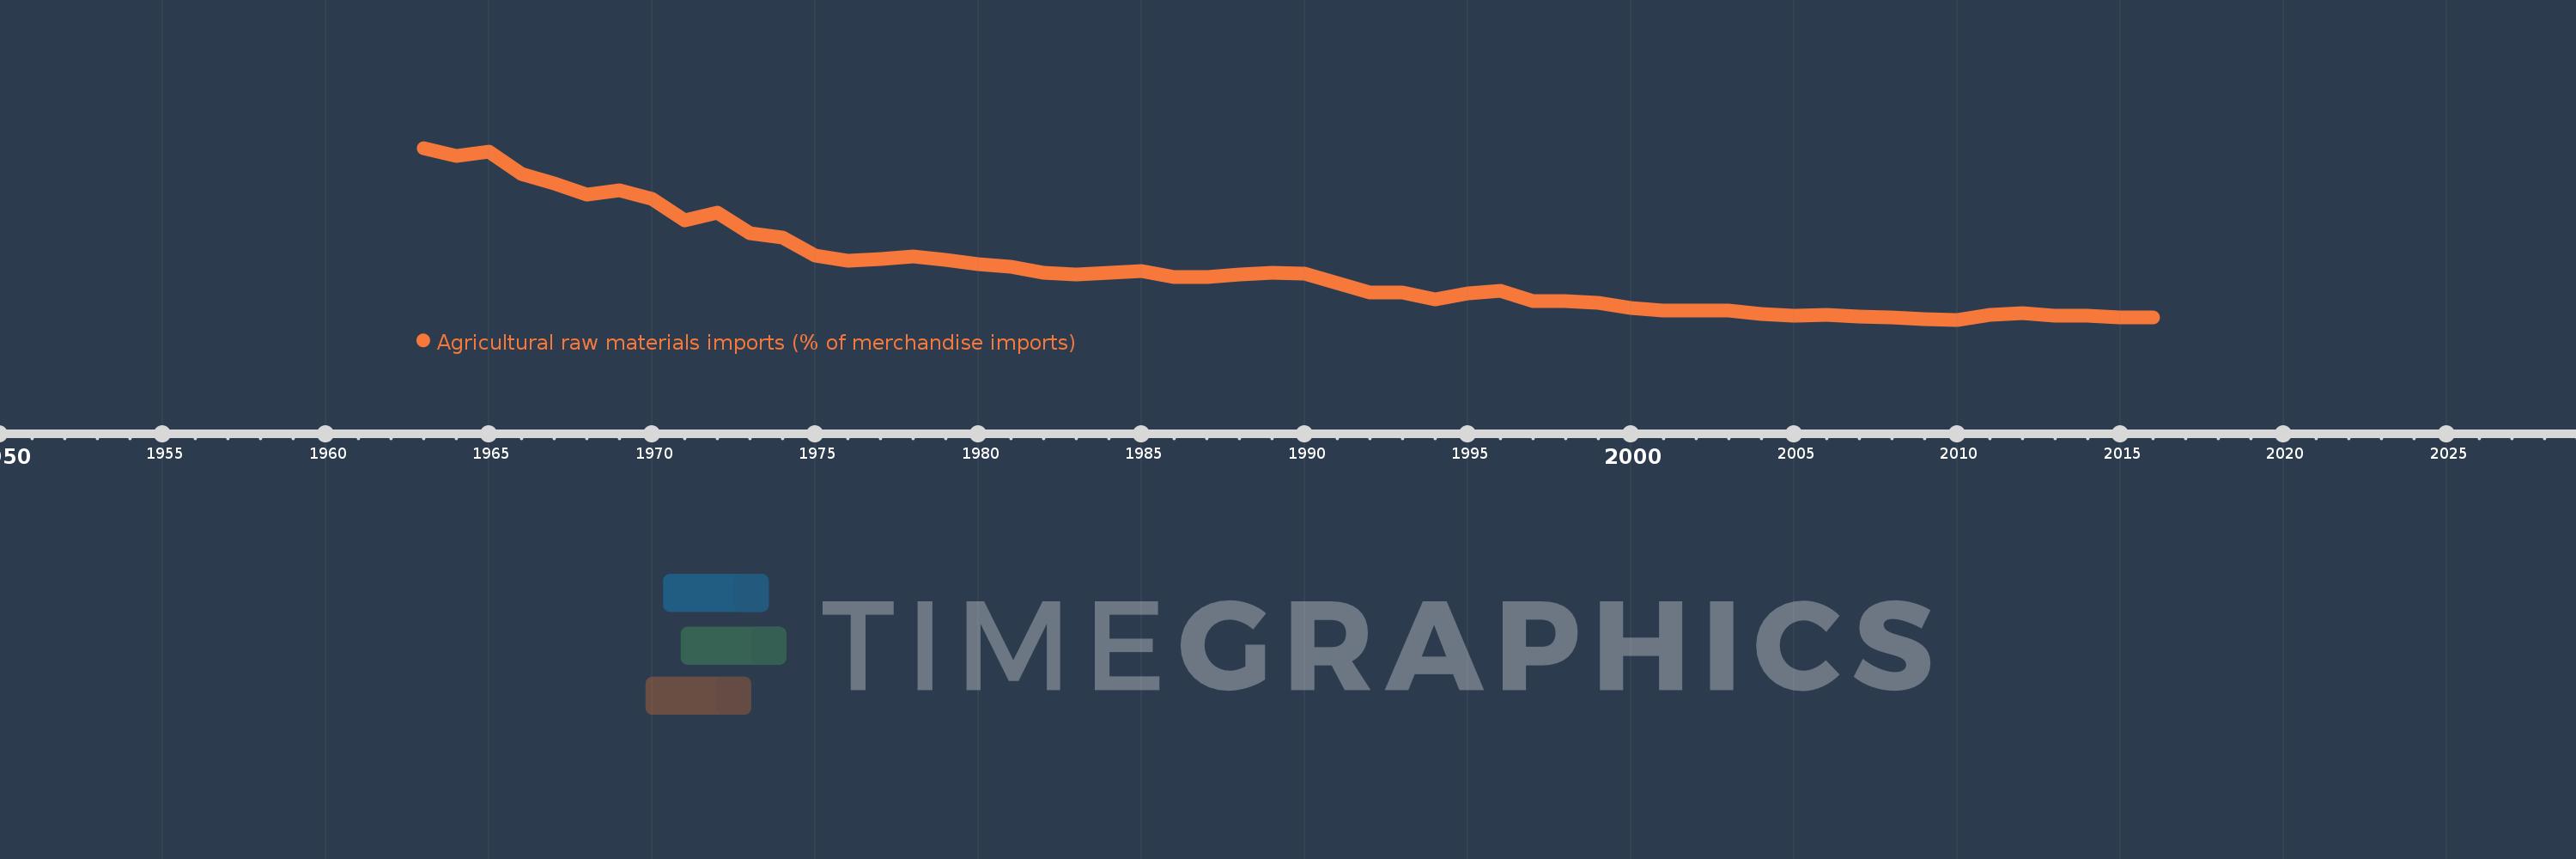
Agricultural raw materials imports (% of merchandise imports)
2016,2015,2014,2013,2012,2011,2010,2009,2008,2007,2006,2005,2004,2003,2002,2001,2000,1999,1998,1997,1996,1995,1994,1993,1992,1991,1990,1989,1988,1987,1986,1985,1984,1983,1982,1981,1980,1979,1978,1977,1976,1975,1974,1973,1972,1971,1970,1969,1968,1967,1966,1965,1964,1963
Diese Statistik in anderen Ländern:
AfghanistanAlbaniaAlgeriaAndorraAngolaAntigua and BarbudaArab WorldArgentinaArmeniaArubaAustraliaAustriaAzerbaijanBahamas, TheBahrainBangladeshBarbadosBelarusBelgiumBelizeBeninBermudaBhutanBoliviaBosnia and HerzegovinaBotswanaBrazilBrunei DarussalamBulgariaBurkina FasoBurundiCabo VerdeCambodiaCameroonCanadaCaribbean small statesCayman IslandsCentral African RepublicCentral Europe and the BalticsChadChileChinaColombiaComorosCongo, Dem. Rep.Congo, Rep.Costa RicaCote d'IvoireCroatiaCubaCyprusCzech RepublicDenmarkDjiboutiDominicaDominican RepublicEarly-demographic dividendEast Asia & PacificEast Asia & Pacific (excluding high income)East Asia & Pacific (IDA & IBRD countries)EcuadorEgypt, Arab Rep.El SalvadorEquatorial GuineaEritreaEstoniaEthiopiaEuro areaEurope & Central AsiaEurope & Central Asia (excluding high income)Europe & Central Asia (IDA & IBRD countries)European UnionFaroe IslandsFijiFinlandFragile and conflict affected situationsFranceFrench PolynesiaGabonGambia, TheGeorgiaGermanyGhanaGreeceGreenlandGrenadaGuatemalaGuineaGuinea-BissauGuyanaHaitiHeavily indebted poor countries (HIPC)High incomeHondurasHong Kong SAR, ChinaHungaryIBRD onlyIcelandIDA & IBRD totalIDA blendIDA onlyIDA totalIndiaIndonesiaIran, Islamic Rep.IraqIrelandIsraelItalyJamaicaJapanJordanKazakhstanKenyaKiribatiKorea, Rep.KuwaitKyrgyz RepublicLao PDRLate-demographic dividendLatin America & Caribbean Latin America & Caribbean (excluding high income)Latin America & the Caribbean (IDA & IBRD countries)LatviaLeast developed countries: UN classificationLebanonLesothoLiberiaLibyaLithuaniaLow & middle incomeLow incomeLower middle incomeLuxembourgMacao SAR, ChinaMacedonia, FYRMadagascarMalawiMalaysiaMaldivesMaliMaltaMauritaniaMauritiusMexicoMiddle East & North AfricaMiddle East & North Africa (excluding high income)Middle East & North Africa (IDA & IBRD countries)Middle incomeMoldovaMongoliaMoroccoMozambiqueMyanmarNamibiaNepalNetherlandsNew CaledoniaNew ZealandNicaraguaNigerNigeriaNorth AmericaNorwayOECD membersOmanOther small statesPacific island small statesPakistanPalauPanamaPapua New GuineaParaguayPeruPhilippinesPolandPortugalPost-demographic dividendPre-demographic dividendQatarRomaniaRussian FederationRwandaSamoaSao Tome and PrincipeSaudi ArabiaSenegalSerbiaSeychellesSierra LeoneSingaporeSlovak RepublicSloveniaSmall statesSolomon IslandsSomaliaSouth AfricaSouth AsiaSouth Asia (IDA & IBRD)SpainSri LankaSt. Kitts and NevisSt. LuciaSt. Vincent and the GrenadinesSub-Saharan Africa Sub-Saharan Africa (excluding high income)Sub-Saharan Africa (IDA & IBRD countries)SudanSurinameSwazilandSwedenSwitzerlandSyrian Arab RepublicTajikistanTanzaniaThailandTimor-LesteTogoTongaTrinidad and TobagoTunisiaTurkeyTurkmenistanTurks and Caicos IslandsTuvaluUgandaUkraineUnited Arab EmiratesUnited KingdomUnited StatesUpper middle incomeUruguayVanuatuVenezuela, RBVietnamVirgin Islands (U.S.)WorldYemen, Rep.ZambiaZimbabwe Zeitlinie:
Diese Zeitleiste vorliegt die Graphik ab 1963 J. bis 2016 J. Germany. Die Angaben bis 1962 J. sind nicht vorhanden. Die Zahl aktueller Beobachtungen nach Daten: 54.
Die Quelle (Bezeichnung):
Kennzahlen der Weltentwicklung
Die Quelle (Einrichtung):
World Bank staff estimates from the Comtrade database maintained by the United Nations Statistics Division.
Kategorien:
Agriculture & Rural Development, Private Sector, Trade
Es wurde aktualisiert:
23 Apr 2017 Jahr
Kennzahlen der Wertänderungen vom Jahr zum Jahr
Minimum:
1.264
1 Jan 2010 Jahr
Maximum:
10.227
1 Jan 1963 Jahr
Zum Datum der Beobachtung
Wert
Absolute Veränderung
Die Veränderung bezüglich dem vorherigen Wert
1 Jan 1963 Jahr
10.227
+10.227
0.0%
1 Jan 1964 Jahr
9.828
-0.399
-3.9%
1 Jan 1965 Jahr
10.049
+0.222
2.26%
1 Jan 1966 Jahr
8.889
-1.16
-11.54%
1 Jan 1967 Jahr
8.355
-0.534
-6.01%
1 Jan 1968 Jahr
7.807
-0.548
-6.56%
1 Jan 1969 Jahr
8.003
+0.195
2.5%
1 Jan 1970 Jahr
7.578
-0.425
-5.31%
1 Jan 1971 Jahr
6.452
-1.126
-14.86%
1 Jan 1972 Jahr
6.847
+0.395
6.13%
1 Jan 1973 Jahr
5.755
-1.092
-15.95%
1 Jan 1974 Jahr
5.57
-0.185
-3.21%
1 Jan 1975 Jahr
4.602
-0.968
-17.37%
1 Jan 1976 Jahr
4.334
-0.269
-5.84%
1 Jan 1977 Jahr
4.42
+0.086
1.99%
1 Jan 1978 Jahr
4.569
+0.148
3.36%
1 Jan 1979 Jahr
4.396
-0.172
-3.77%
1 Jan 1980 Jahr
4.142
-0.254
-5.78%
1 Jan 1981 Jahr
4.015
-0.128
-3.08%
1 Jan 1982 Jahr
3.725
-0.29
-7.23%
1 Jan 1983 Jahr
3.614
-0.11
-2.96%
1 Jan 1984 Jahr
3.732
+0.117
3.25%
1 Jan 1985 Jahr
3.826
+0.094
2.52%
1 Jan 1986 Jahr
3.492
-0.334
-8.73%
1 Jan 1987 Jahr
3.504
+0.012
0.35%
1 Jan 1988 Jahr
3.617
+0.113
3.24%
1 Jan 1989 Jahr
3.702
+0.085
2.34%
1 Jan 1990 Jahr
3.665
-0.037
-1.01%
1 Jan 1991 Jahr
3.157
-0.507
-13.84%
1 Jan 1992 Jahr
2.663
-0.494
-15.66%
1 Jan 1993 Jahr
2.702
+0.039
1.48%
1 Jan 1994 Jahr
2.345
-0.357
-13.22%
1 Jan 1995 Jahr
2.65
+0.305
13.01%
1 Jan 1996 Jahr
2.781
+0.131
4.94%
1 Jan 1997 Jahr
2.25
-0.531
-19.09%
1 Jan 1998 Jahr
2.231
-0.019
-0.86%
1 Jan 1999 Jahr
2.127
-0.104
-4.64%
1 Jan 2000 Jahr
1.889
-0.239
-11.23%
1 Jan 2001 Jahr
1.739
-0.149
-7.89%
1 Jan 2002 Jahr
1.727
-0.013
-0.73%
1 Jan 2003 Jahr
1.741
+0.014
0.81%
1 Jan 2004 Jahr
1.577
-0.163
-9.38%
1 Jan 2005 Jahr
1.474
-0.103
-6.53%
1 Jan 2006 Jahr
1.504
+0.03
2.03%
1 Jan 2007 Jahr
1.413
-0.091
-6.07%
1 Jan 2008 Jahr
1.37
-0.043
-3.05%
1 Jan 2009 Jahr
1.284
-0.086
-6.3%
1 Jan 2010 Jahr
1.264
-0.019
-1.49%
1 Jan 2011 Jahr
1.519
+0.254
20.11%
1 Jan 2012 Jahr
1.603
+0.085
5.57%
1 Jan 2013 Jahr
1.491
-0.112
-7.01%
1 Jan 2014 Jahr
1.472
-0.019
-1.3%
1 Jan 2015 Jahr
1.405
-0.067
-4.53%
1 Jan 2016 Jahr
1.367
-0.038
-2.7%
Bewertung der Länder gemäß mit laufender Statistik nach Jahren


Kommentare: