29
/de/
de
AIzaSyAYiBZKx7MnpbEhh9jyipgxe19OcubqV5w
April 1, 2024
257033
Switzerland
CHE
true
2
1
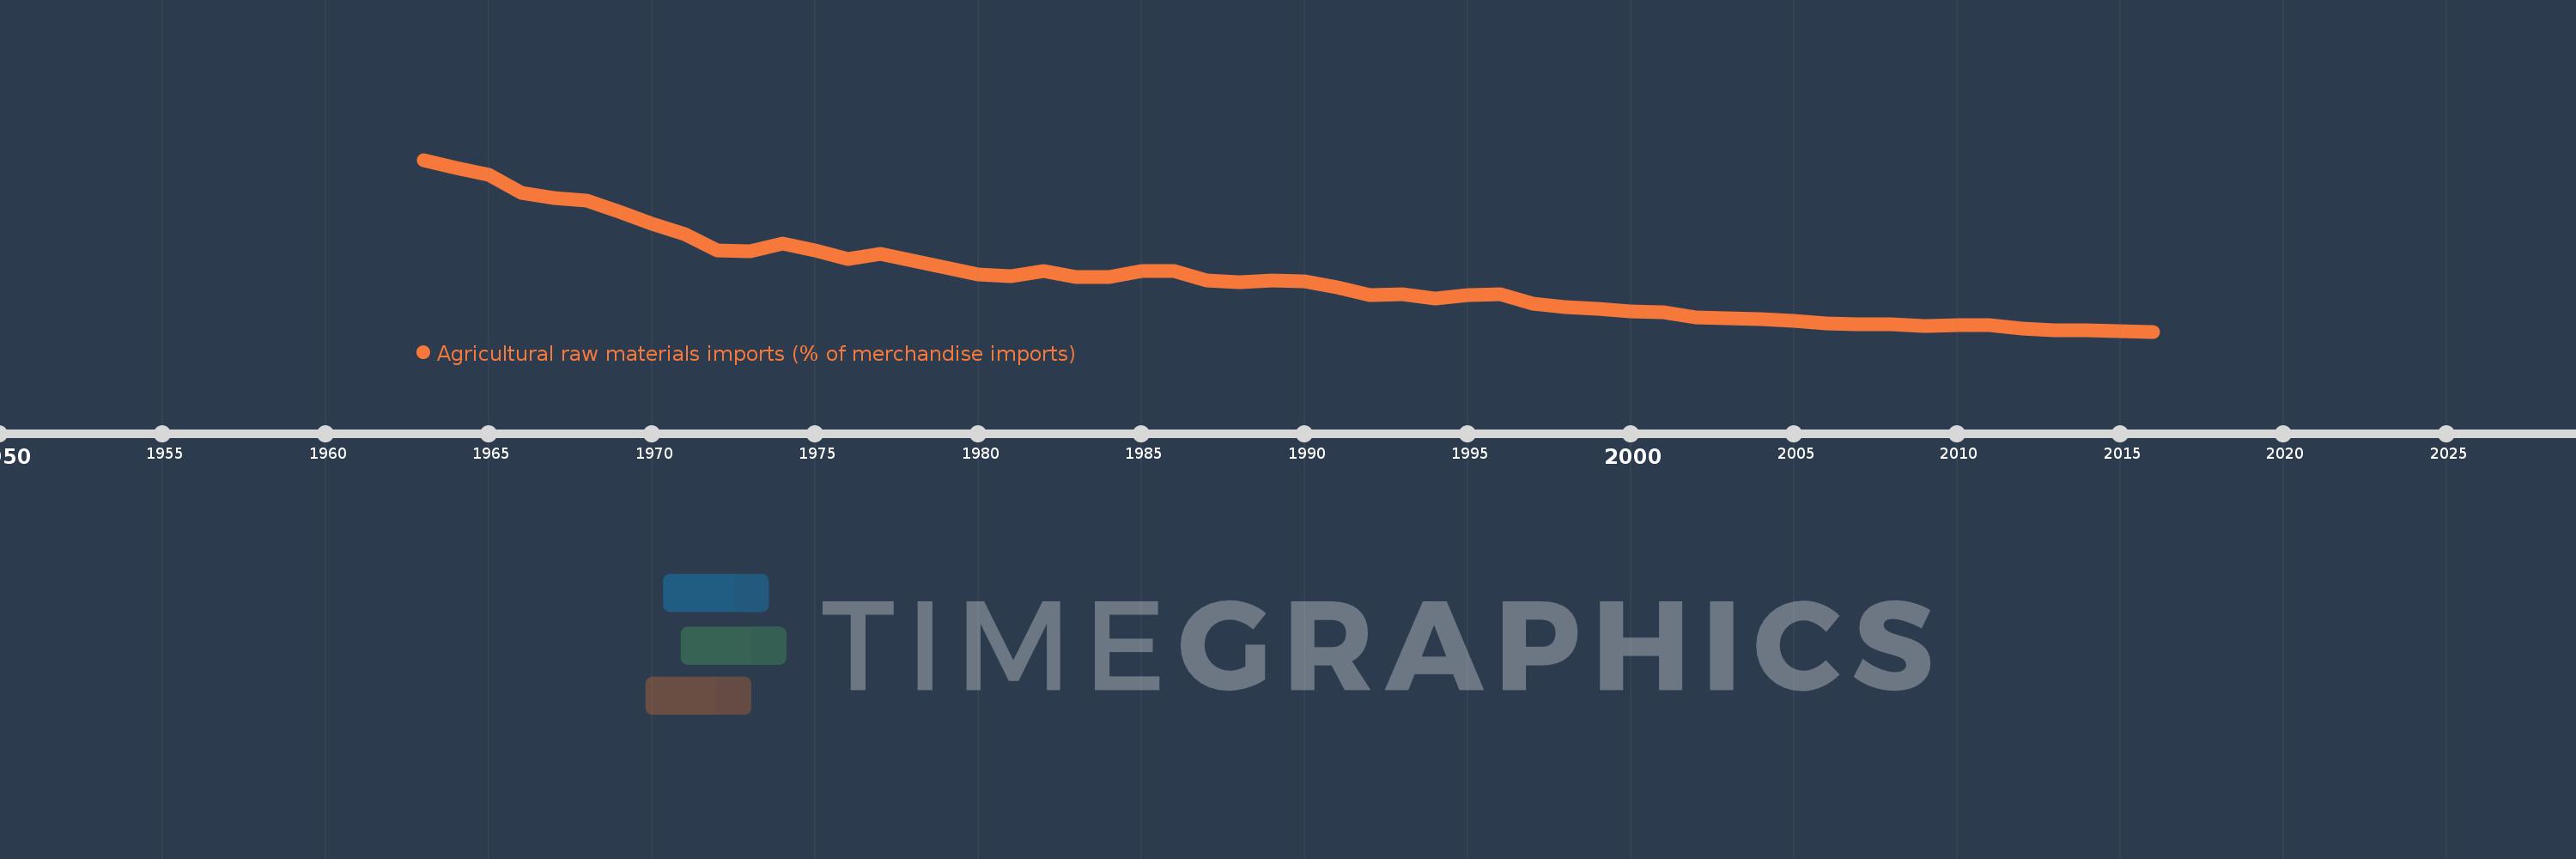
Agricultural raw materials imports (% of merchandise imports)
2016,2015,2014,2013,2012,2011,2010,2009,2008,2007,2006,2005,2004,2003,2002,2001,2000,1999,1998,1997,1996,1995,1994,1993,1992,1991,1990,1989,1988,1987,1986,1985,1984,1983,1982,1981,1980,1979,1978,1977,1976,1975,1974,1973,1972,1971,1970,1969,1968,1967,1966,1965,1964,1963
Diese Statistik in anderen Ländern:
AfghanistanAlbaniaAlgeriaAndorraAngolaAntigua and BarbudaArab WorldArgentinaArmeniaArubaAustraliaAustriaAzerbaijanBahamas, TheBahrainBangladeshBarbadosBelarusBelgiumBelizeBeninBermudaBhutanBoliviaBosnia and HerzegovinaBotswanaBrazilBrunei DarussalamBulgariaBurkina FasoBurundiCabo VerdeCambodiaCameroonCanadaCaribbean small statesCayman IslandsCentral African RepublicCentral Europe and the BalticsChadChileChinaColombiaComorosCongo, Dem. Rep.Congo, Rep.Costa RicaCote d'IvoireCroatiaCubaCyprusCzech RepublicDenmarkDjiboutiDominicaDominican RepublicEarly-demographic dividendEast Asia & PacificEast Asia & Pacific (excluding high income)East Asia & Pacific (IDA & IBRD countries)EcuadorEgypt, Arab Rep.El SalvadorEquatorial GuineaEritreaEstoniaEthiopiaEuro areaEurope & Central AsiaEurope & Central Asia (excluding high income)Europe & Central Asia (IDA & IBRD countries)European UnionFaroe IslandsFijiFinlandFragile and conflict affected situationsFranceFrench PolynesiaGabonGambia, TheGeorgiaGermanyGhanaGreeceGreenlandGrenadaGuatemalaGuineaGuinea-BissauGuyanaHaitiHeavily indebted poor countries (HIPC)High incomeHondurasHong Kong SAR, ChinaHungaryIBRD onlyIcelandIDA & IBRD totalIDA blendIDA onlyIDA totalIndiaIndonesiaIran, Islamic Rep.IraqIrelandIsraelItalyJamaicaJapanJordanKazakhstanKenyaKiribatiKorea, Rep.KuwaitKyrgyz RepublicLao PDRLate-demographic dividendLatin America & Caribbean Latin America & Caribbean (excluding high income)Latin America & the Caribbean (IDA & IBRD countries)LatviaLeast developed countries: UN classificationLebanonLesothoLiberiaLibyaLithuaniaLow & middle incomeLow incomeLower middle incomeLuxembourgMacao SAR, ChinaMacedonia, FYRMadagascarMalawiMalaysiaMaldivesMaliMaltaMauritaniaMauritiusMexicoMiddle East & North AfricaMiddle East & North Africa (excluding high income)Middle East & North Africa (IDA & IBRD countries)Middle incomeMoldovaMongoliaMoroccoMozambiqueMyanmarNamibiaNepalNetherlandsNew CaledoniaNew ZealandNicaraguaNigerNigeriaNorth AmericaNorwayOECD membersOmanOther small statesPacific island small statesPakistanPalauPanamaPapua New GuineaParaguayPeruPhilippinesPolandPortugalPost-demographic dividendPre-demographic dividendQatarRomaniaRussian FederationRwandaSamoaSao Tome and PrincipeSaudi ArabiaSenegalSerbiaSeychellesSierra LeoneSingaporeSlovak RepublicSloveniaSmall statesSolomon IslandsSomaliaSouth AfricaSouth AsiaSouth Asia (IDA & IBRD)SpainSri LankaSt. Kitts and NevisSt. LuciaSt. Vincent and the GrenadinesSub-Saharan Africa Sub-Saharan Africa (excluding high income)Sub-Saharan Africa (IDA & IBRD countries)SudanSurinameSwazilandSwedenSwitzerlandSyrian Arab RepublicTajikistanTanzaniaThailandTimor-LesteTogoTongaTrinidad and TobagoTunisiaTurkeyTurkmenistanTurks and Caicos IslandsTuvaluUgandaUkraineUnited Arab EmiratesUnited KingdomUnited StatesUpper middle incomeUruguayVanuatuVenezuela, RBVietnamVirgin Islands (U.S.)WorldYemen, Rep.ZambiaZimbabwe Zeitlinie:
Diese Zeitleiste vorliegt die Graphik ab 1963 J. bis 2016 J. Switzerland. Die Angaben bis 1962 J. sind nicht vorhanden. Die Zahl aktueller Beobachtungen nach Daten: 54.
Die Quelle (Bezeichnung):
Kennzahlen der Weltentwicklung
Die Quelle (Einrichtung):
World Bank staff estimates from the Comtrade database maintained by the United Nations Statistics Division.
Kategorien:
Agriculture & Rural Development, Private Sector, Trade
Es wurde aktualisiert:
23 Apr 2017 Jahr
Kennzahlen der Wertänderungen vom Jahr zum Jahr
Minimum:
0.802
1 Jan 2016 Jahr
Maximum:
6.36
1 Jan 1963 Jahr
Zum Datum der Beobachtung
Wert
Absolute Veränderung
Die Veränderung bezüglich dem vorherigen Wert
1 Jan 1963 Jahr
6.36
+6.36
0.0%
1 Jan 1964 Jahr
6.105
-0.255
-4.01%
1 Jan 1965 Jahr
5.882
-0.223
-3.66%
1 Jan 1966 Jahr
5.297
-0.584
-9.93%
1 Jan 1967 Jahr
5.135
-0.162
-3.06%
1 Jan 1968 Jahr
5.041
-0.094
-1.84%
1 Jan 1969 Jahr
4.665
-0.376
-7.46%
1 Jan 1970 Jahr
4.298
-0.367
-7.87%
1 Jan 1971 Jahr
3.943
-0.355
-8.26%
1 Jan 1972 Jahr
3.441
-0.502
-12.74%
1 Jan 1973 Jahr
3.394
-0.046
-1.35%
1 Jan 1974 Jahr
3.649
+0.255
7.5%
1 Jan 1975 Jahr
3.416
-0.233
-6.38%
1 Jan 1976 Jahr
3.156
-0.26
-7.61%
1 Jan 1977 Jahr
3.315
+0.159
5.03%
1 Jan 1978 Jahr
3.092
-0.223
-6.72%
1 Jan 1979 Jahr
2.862
-0.23
-7.43%
1 Jan 1980 Jahr
2.637
-0.225
-7.85%
1 Jan 1981 Jahr
2.602
-0.035
-1.33%
1 Jan 1982 Jahr
2.765
+0.163
6.25%
1 Jan 1983 Jahr
2.569
-0.196
-7.07%
1 Jan 1984 Jahr
2.58
+0.011
0.41%
1 Jan 1985 Jahr
2.753
+0.173
6.71%
1 Jan 1986 Jahr
2.749
-0.004
-0.13%
1 Jan 1987 Jahr
2.469
-0.281
-10.21%
1 Jan 1988 Jahr
2.396
-0.072
-2.94%
1 Jan 1989 Jahr
2.451
+0.055
2.3%
1 Jan 1990 Jahr
2.427
-0.024
-0.97%
1 Jan 1991 Jahr
2.224
-0.203
-8.37%
1 Jan 1992 Jahr
1.992
-0.232
-10.43%
1 Jan 1993 Jahr
2.014
+0.021
1.07%
1 Jan 1994 Jahr
1.866
-0.148
-7.33%
1 Jan 1995 Jahr
1.978
+0.112
6.02%
1 Jan 1996 Jahr
1.998
+0.02
0.99%
1 Jan 1997 Jahr
1.706
-0.292
-14.63%
1 Jan 1998 Jahr
1.584
-0.121
-7.12%
1 Jan 1999 Jahr
1.531
-0.054
-3.38%
1 Jan 2000 Jahr
1.449
-0.081
-5.31%
1 Jan 2001 Jahr
1.428
-0.021
-1.47%
1 Jan 2002 Jahr
1.249
-0.179
-12.51%
1 Jan 2003 Jahr
1.226
-0.023
-1.86%
1 Jan 2004 Jahr
1.213
-0.013
-1.1%
1 Jan 2005 Jahr
1.154
-0.059
-4.85%
1 Jan 2006 Jahr
1.078
-0.076
-6.57%
1 Jan 2007 Jahr
1.036
-0.042
-3.88%
1 Jan 2008 Jahr
1.042
+0.006
0.61%
1 Jan 2009 Jahr
0.996
-0.046
-4.44%
1 Jan 2010 Jahr
0.998
+0.001
0.15%
1 Jan 2011 Jahr
1.004
+0.006
0.62%
1 Jan 2012 Jahr
0.903
-0.1
-10.01%
1 Jan 2013 Jahr
0.839
-0.065
-7.16%
1 Jan 2014 Jahr
0.844
+0.005
0.56%
1 Jan 2015 Jahr
0.829
-0.014
-1.68%
1 Jan 2016 Jahr
0.802
-0.027
-3.3%
Bewertung der Länder gemäß mit laufender Statistik nach Jahren


Kommentare: