29
/de/
de
AIzaSyAYiBZKx7MnpbEhh9jyipgxe19OcubqV5w
April 1, 2024
267625
Tunisia
TUN
true
2
1
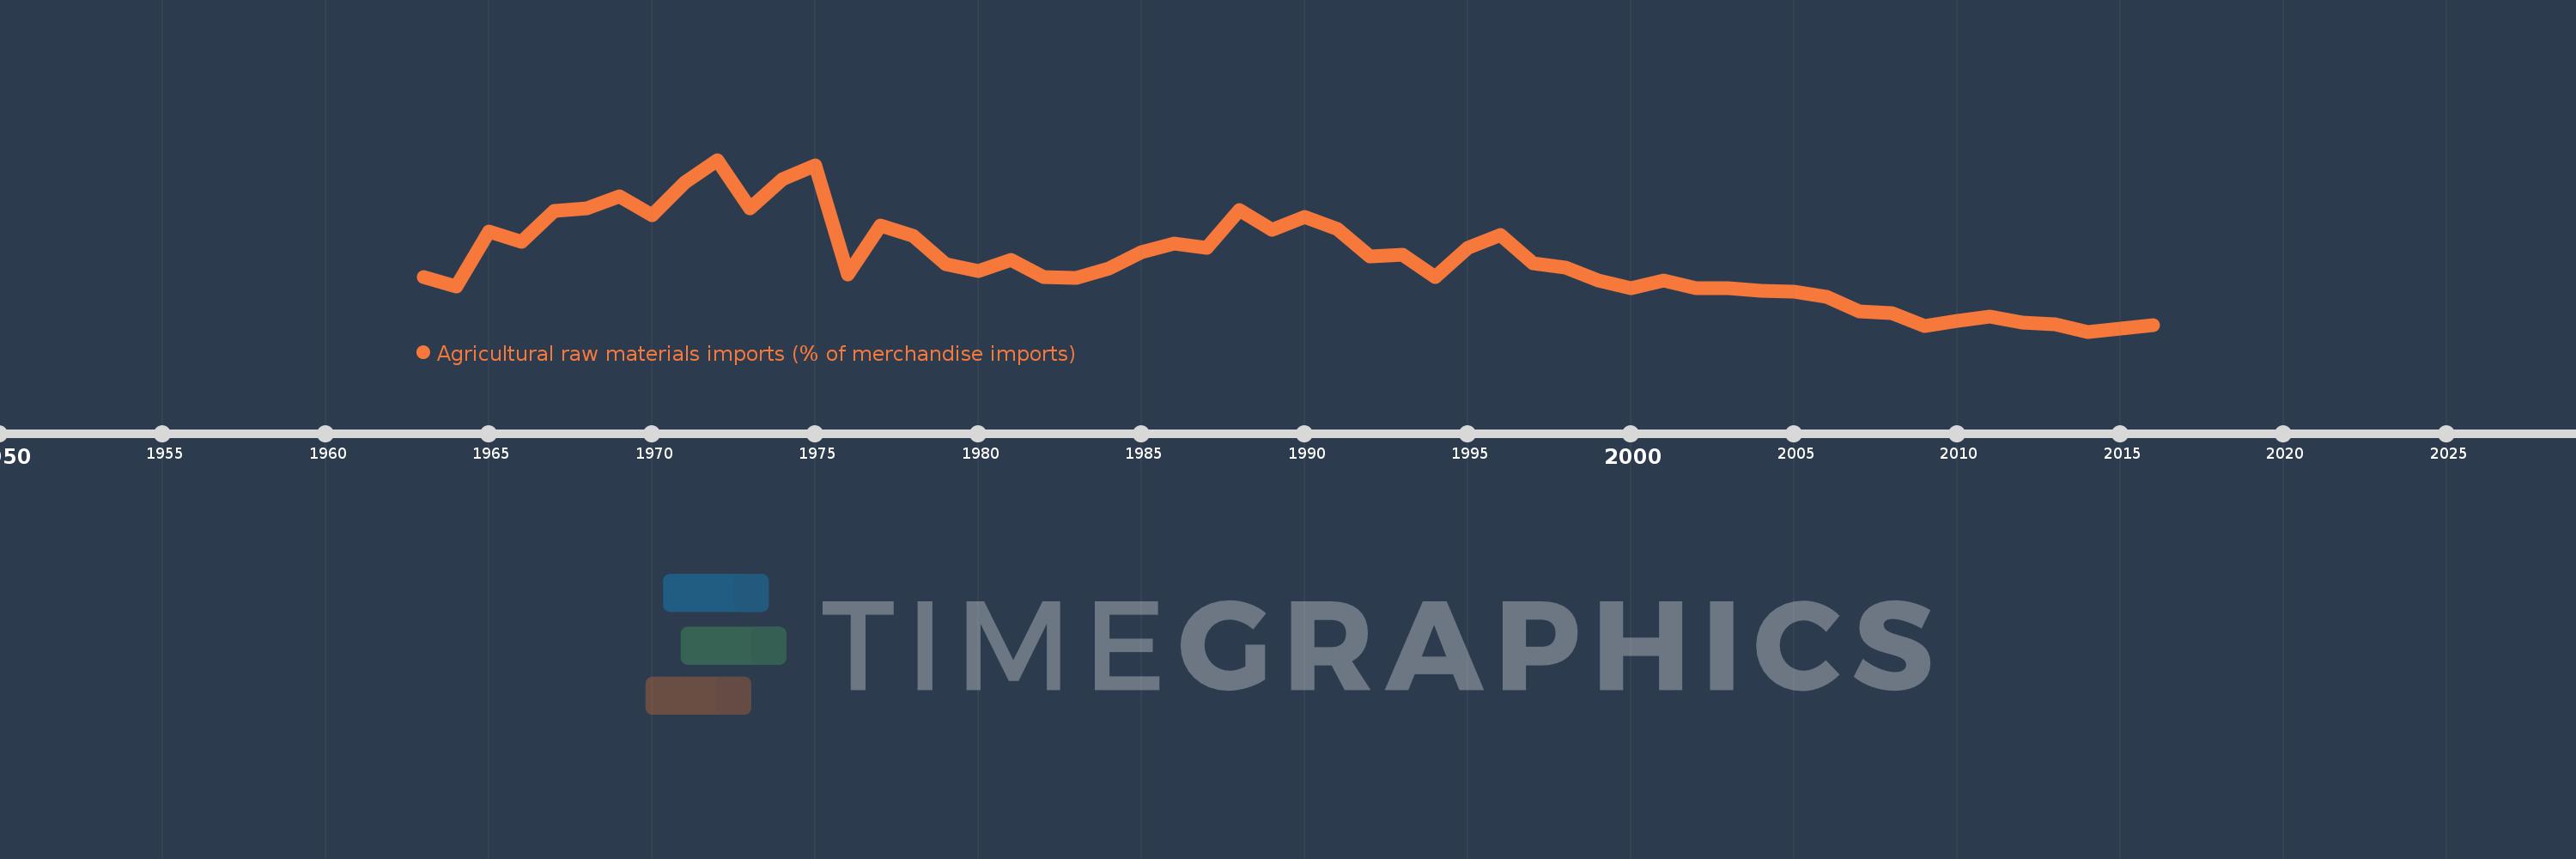
Agricultural raw materials imports (% of merchandise imports)
2016,2015,2014,2013,2012,2011,2010,2009,2008,2007,2006,2005,2004,2003,2002,2001,2000,1999,1998,1997,1996,1995,1994,1993,1992,1991,1990,1989,1988,1987,1986,1985,1984,1983,1982,1981,1980,1979,1978,1977,1976,1975,1974,1973,1972,1971,1970,1969,1968,1967,1966,1965,1964,1963
Diese Statistik in anderen Ländern:
AfghanistanAlbaniaAlgeriaAndorraAngolaAntigua and BarbudaArab WorldArgentinaArmeniaArubaAustraliaAustriaAzerbaijanBahamas, TheBahrainBangladeshBarbadosBelarusBelgiumBelizeBeninBermudaBhutanBoliviaBosnia and HerzegovinaBotswanaBrazilBrunei DarussalamBulgariaBurkina FasoBurundiCabo VerdeCambodiaCameroonCanadaCaribbean small statesCayman IslandsCentral African RepublicCentral Europe and the BalticsChadChileChinaColombiaComorosCongo, Dem. Rep.Congo, Rep.Costa RicaCote d'IvoireCroatiaCubaCyprusCzech RepublicDenmarkDjiboutiDominicaDominican RepublicEarly-demographic dividendEast Asia & PacificEast Asia & Pacific (excluding high income)East Asia & Pacific (IDA & IBRD countries)EcuadorEgypt, Arab Rep.El SalvadorEquatorial GuineaEritreaEstoniaEthiopiaEuro areaEurope & Central AsiaEurope & Central Asia (excluding high income)Europe & Central Asia (IDA & IBRD countries)European UnionFaroe IslandsFijiFinlandFragile and conflict affected situationsFranceFrench PolynesiaGabonGambia, TheGeorgiaGermanyGhanaGreeceGreenlandGrenadaGuatemalaGuineaGuinea-BissauGuyanaHaitiHeavily indebted poor countries (HIPC)High incomeHondurasHong Kong SAR, ChinaHungaryIBRD onlyIcelandIDA & IBRD totalIDA blendIDA onlyIDA totalIndiaIndonesiaIran, Islamic Rep.IraqIrelandIsraelItalyJamaicaJapanJordanKazakhstanKenyaKiribatiKorea, Rep.KuwaitKyrgyz RepublicLao PDRLate-demographic dividendLatin America & Caribbean Latin America & Caribbean (excluding high income)Latin America & the Caribbean (IDA & IBRD countries)LatviaLeast developed countries: UN classificationLebanonLesothoLiberiaLibyaLithuaniaLow & middle incomeLow incomeLower middle incomeLuxembourgMacao SAR, ChinaMacedonia, FYRMadagascarMalawiMalaysiaMaldivesMaliMaltaMauritaniaMauritiusMexicoMiddle East & North AfricaMiddle East & North Africa (excluding high income)Middle East & North Africa (IDA & IBRD countries)Middle incomeMoldovaMongoliaMoroccoMozambiqueMyanmarNamibiaNepalNetherlandsNew CaledoniaNew ZealandNicaraguaNigerNigeriaNorth AmericaNorwayOECD membersOmanOther small statesPacific island small statesPakistanPalauPanamaPapua New GuineaParaguayPeruPhilippinesPolandPortugalPost-demographic dividendPre-demographic dividendQatarRomaniaRussian FederationRwandaSamoaSao Tome and PrincipeSaudi ArabiaSenegalSerbiaSeychellesSierra LeoneSingaporeSlovak RepublicSloveniaSmall statesSolomon IslandsSomaliaSouth AfricaSouth AsiaSouth Asia (IDA & IBRD)SpainSri LankaSt. Kitts and NevisSt. LuciaSt. Vincent and the GrenadinesSub-Saharan Africa Sub-Saharan Africa (excluding high income)Sub-Saharan Africa (IDA & IBRD countries)SudanSurinameSwazilandSwedenSwitzerlandSyrian Arab RepublicTajikistanTanzaniaThailandTimor-LesteTogoTongaTrinidad and TobagoTunisiaTurkeyTurkmenistanTurks and Caicos IslandsTuvaluUgandaUkraineUnited Arab EmiratesUnited KingdomUnited StatesUpper middle incomeUruguayVanuatuVenezuela, RBVietnamVirgin Islands (U.S.)WorldYemen, Rep.ZambiaZimbabwe Zeitlinie:
Diese Zeitleiste vorliegt die Graphik ab 1963 J. bis 2016 J. Tunisia. Die Angaben bis 1962 J. sind nicht vorhanden. Die Zahl aktueller Beobachtungen nach Daten: 54.
Die Quelle (Bezeichnung):
Kennzahlen der Weltentwicklung
Die Quelle (Einrichtung):
World Bank staff estimates from the Comtrade database maintained by the United Nations Statistics Division.
Kategorien:
Agriculture & Rural Development, Private Sector, Trade
Es wurde aktualisiert:
23 Apr 2017 Jahr
Kennzahlen der Wertänderungen vom Jahr zum Jahr
Minimum:
1.77
1 Jan 2014 Jahr
Maximum:
6.07
1 Jan 1972 Jahr
Zum Datum der Beobachtung
Wert
Absolute Veränderung
Die Veränderung bezüglich dem vorherigen Wert
1 Jan 1963 Jahr
3.144
+3.144
0.0%
1 Jan 1964 Jahr
2.893
-0.251
-7.98%
1 Jan 1965 Jahr
4.272
+1.379
47.65%
1 Jan 1966 Jahr
4.024
-0.248
-5.82%
1 Jan 1967 Jahr
4.786
+0.763
18.96%
1 Jan 1968 Jahr
4.863
+0.077
1.6%
1 Jan 1969 Jahr
5.148
+0.285
5.86%
1 Jan 1970 Jahr
4.679
-0.469
-9.11%
1 Jan 1971 Jahr
5.496
+0.817
17.46%
1 Jan 1972 Jahr
6.07
+0.575
10.45%
1 Jan 1973 Jahr
4.845
-1.225
-20.19%
1 Jan 1974 Jahr
5.595
+0.751
15.49%
1 Jan 1975 Jahr
5.933
+0.337
6.03%
1 Jan 1976 Jahr
3.209
-2.724
-45.91%
1 Jan 1977 Jahr
4.418
+1.209
37.66%
1 Jan 1978 Jahr
4.174
-0.244
-5.53%
1 Jan 1979 Jahr
3.458
-0.716
-17.15%
1 Jan 1980 Jahr
3.287
-0.17
-4.93%
1 Jan 1981 Jahr
3.57
+0.282
8.59%
1 Jan 1982 Jahr
3.135
-0.435
-12.18%
1 Jan 1983 Jahr
3.119
-0.016
-0.51%
1 Jan 1984 Jahr
3.353
+0.235
7.52%
1 Jan 1985 Jahr
3.759
+0.405
12.09%
1 Jan 1986 Jahr
3.984
+0.226
6.0%
1 Jan 1987 Jahr
3.875
-0.11
-2.76%
1 Jan 1988 Jahr
4.811
+0.936
24.16%
1 Jan 1989 Jahr
4.328
-0.482
-10.03%
1 Jan 1990 Jahr
4.638
+0.31
7.16%
1 Jan 1991 Jahr
4.338
-0.3
-6.48%
1 Jan 1992 Jahr
3.652
-0.686
-15.81%
1 Jan 1993 Jahr
3.693
+0.042
1.15%
1 Jan 1994 Jahr
3.138
-0.556
-15.05%
1 Jan 1995 Jahr
3.876
+0.738
23.53%
1 Jan 1996 Jahr
4.196
+0.32
8.26%
1 Jan 1997 Jahr
3.488
-0.708
-16.88%
1 Jan 1998 Jahr
3.378
-0.11
-3.15%
1 Jan 1999 Jahr
3.047
-0.331
-9.81%
1 Jan 2000 Jahr
2.849
-0.197
-6.47%
1 Jan 2001 Jahr
3.06
+0.211
7.39%
1 Jan 2002 Jahr
2.855
-0.205
-6.71%
1 Jan 2003 Jahr
2.862
+0.007
0.26%
1 Jan 2004 Jahr
2.792
-0.07
-2.44%
1 Jan 2005 Jahr
2.772
-0.021
-0.73%
1 Jan 2006 Jahr
2.637
-0.135
-4.86%
1 Jan 2007 Jahr
2.283
-0.354
-13.43%
1 Jan 2008 Jahr
2.227
-0.056
-2.44%
1 Jan 2009 Jahr
1.905
-0.322
-14.46%
1 Jan 2010 Jahr
2.033
+0.128
6.69%
1 Jan 2011 Jahr
2.137
+0.104
5.12%
1 Jan 2012 Jahr
2.005
-0.131
-6.15%
1 Jan 2013 Jahr
1.954
-0.051
-2.55%
1 Jan 2014 Jahr
1.77
-0.184
-9.43%
1 Jan 2015 Jahr
1.855
+0.085
4.81%
1 Jan 2016 Jahr
1.927
+0.072
3.89%
Bewertung der Länder gemäß mit laufender Statistik nach Jahren


Kommentare: