29
/de/
de
AIzaSyAYiBZKx7MnpbEhh9jyipgxe19OcubqV5w
April 1, 2024
152230
Hungary
HUN
true
2
1
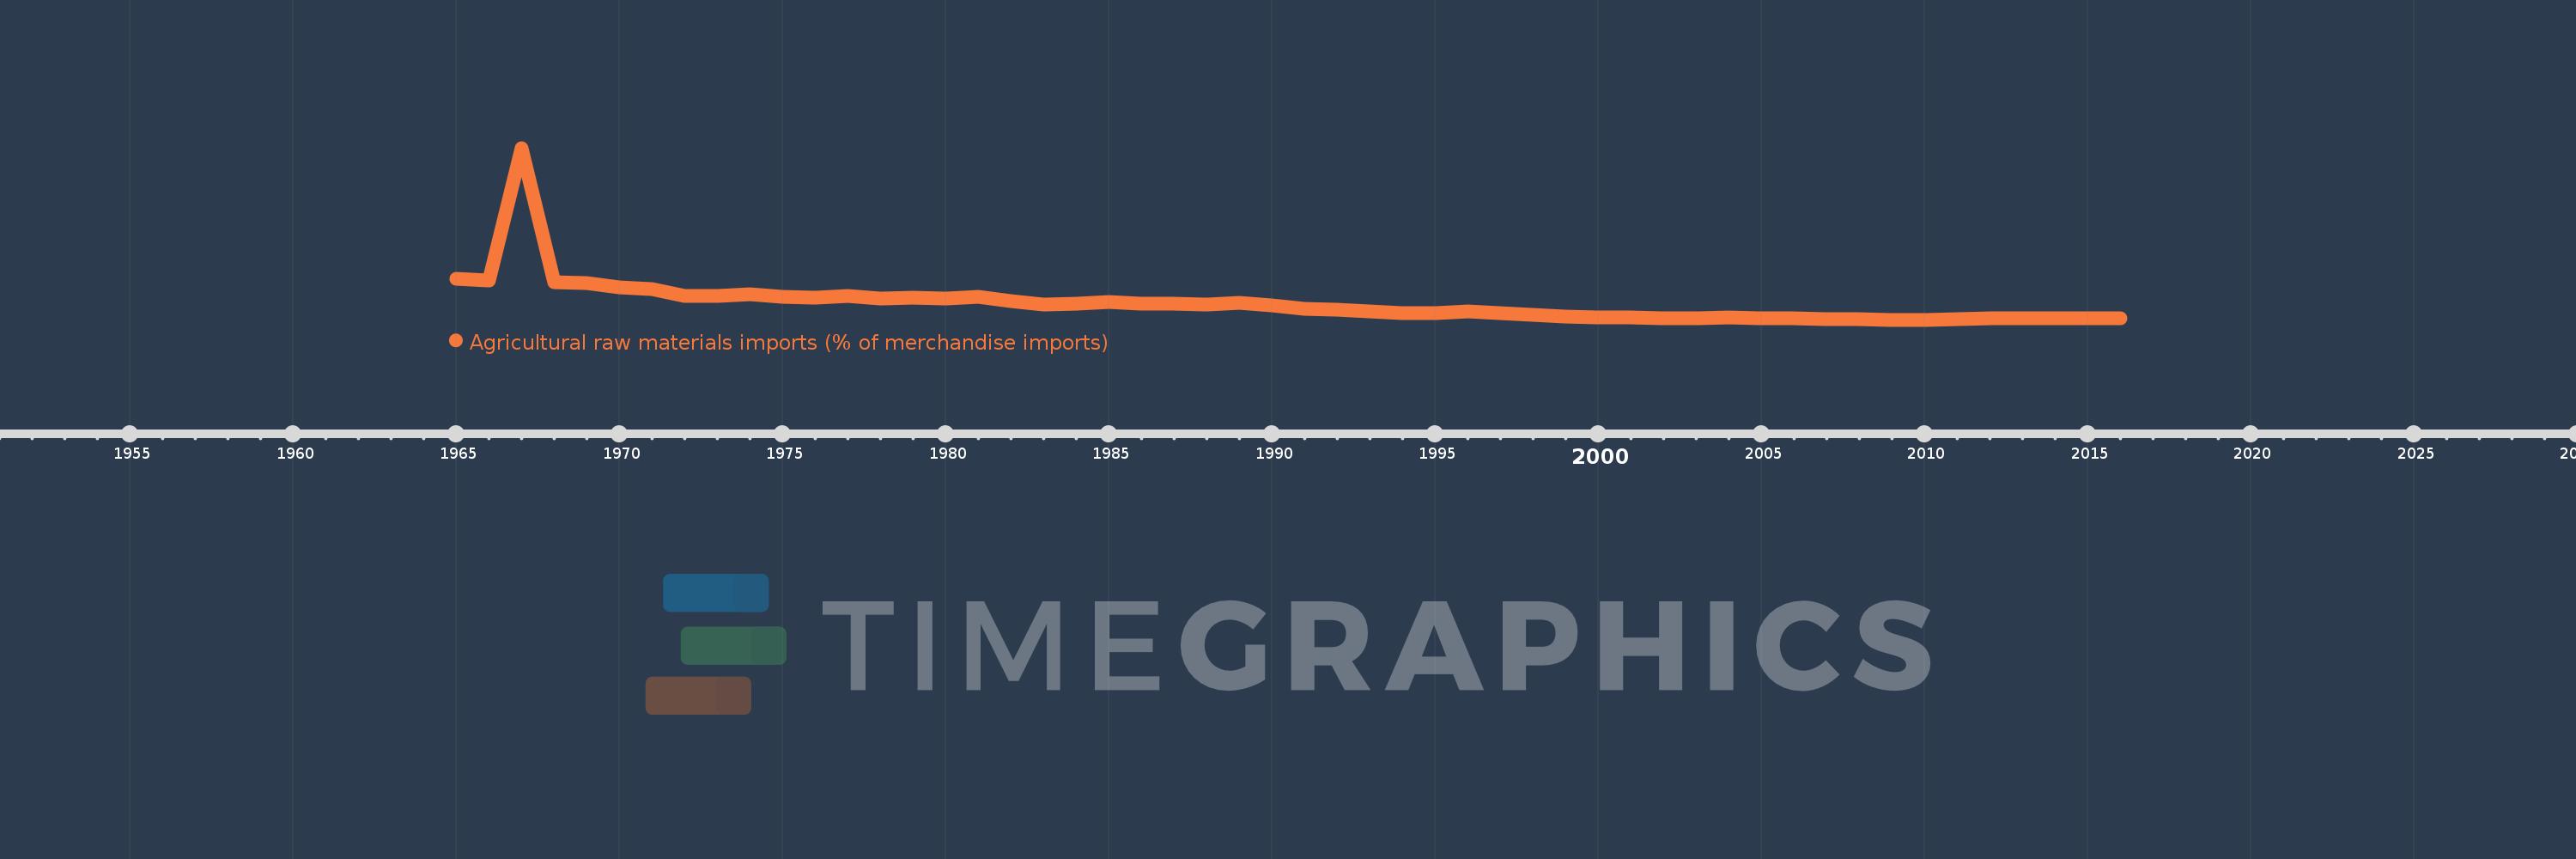
Agricultural raw materials imports (% of merchandise imports)
2016,2015,2014,2013,2012,2011,2010,2009,2008,2007,2006,2005,2004,2003,2002,2001,2000,1999,1998,1997,1996,1995,1994,1993,1992,1991,1990,1989,1988,1987,1986,1985,1984,1983,1982,1981,1980,1979,1978,1977,1976,1975,1974,1973,1972,1971,1970,1969,1968,1967,1966,1965
Diese Statistik in anderen Ländern:
AfghanistanAlbaniaAlgeriaAndorraAngolaAntigua and BarbudaArab WorldArgentinaArmeniaArubaAustraliaAustriaAzerbaijanBahamas, TheBahrainBangladeshBarbadosBelarusBelgiumBelizeBeninBermudaBhutanBoliviaBosnia and HerzegovinaBotswanaBrazilBrunei DarussalamBulgariaBurkina FasoBurundiCabo VerdeCambodiaCameroonCanadaCaribbean small statesCayman IslandsCentral African RepublicCentral Europe and the BalticsChadChileChinaColombiaComorosCongo, Dem. Rep.Congo, Rep.Costa RicaCote d'IvoireCroatiaCubaCyprusCzech RepublicDenmarkDjiboutiDominicaDominican RepublicEarly-demographic dividendEast Asia & PacificEast Asia & Pacific (excluding high income)East Asia & Pacific (IDA & IBRD countries)EcuadorEgypt, Arab Rep.El SalvadorEquatorial GuineaEritreaEstoniaEthiopiaEuro areaEurope & Central AsiaEurope & Central Asia (excluding high income)Europe & Central Asia (IDA & IBRD countries)European UnionFaroe IslandsFijiFinlandFragile and conflict affected situationsFranceFrench PolynesiaGabonGambia, TheGeorgiaGermanyGhanaGreeceGreenlandGrenadaGuatemalaGuineaGuinea-BissauGuyanaHaitiHeavily indebted poor countries (HIPC)High incomeHondurasHong Kong SAR, ChinaHungaryIBRD onlyIcelandIDA & IBRD totalIDA blendIDA onlyIDA totalIndiaIndonesiaIran, Islamic Rep.IraqIrelandIsraelItalyJamaicaJapanJordanKazakhstanKenyaKiribatiKorea, Rep.KuwaitKyrgyz RepublicLao PDRLate-demographic dividendLatin America & Caribbean Latin America & Caribbean (excluding high income)Latin America & the Caribbean (IDA & IBRD countries)LatviaLeast developed countries: UN classificationLebanonLesothoLiberiaLibyaLithuaniaLow & middle incomeLow incomeLower middle incomeLuxembourgMacao SAR, ChinaMacedonia, FYRMadagascarMalawiMalaysiaMaldivesMaliMaltaMauritaniaMauritiusMexicoMiddle East & North AfricaMiddle East & North Africa (excluding high income)Middle East & North Africa (IDA & IBRD countries)Middle incomeMoldovaMongoliaMoroccoMozambiqueMyanmarNamibiaNepalNetherlandsNew CaledoniaNew ZealandNicaraguaNigerNigeriaNorth AmericaNorwayOECD membersOmanOther small statesPacific island small statesPakistanPalauPanamaPapua New GuineaParaguayPeruPhilippinesPolandPortugalPost-demographic dividendPre-demographic dividendQatarRomaniaRussian FederationRwandaSamoaSao Tome and PrincipeSaudi ArabiaSenegalSerbiaSeychellesSierra LeoneSingaporeSlovak RepublicSloveniaSmall statesSolomon IslandsSomaliaSouth AfricaSouth AsiaSouth Asia (IDA & IBRD)SpainSri LankaSt. Kitts and NevisSt. LuciaSt. Vincent and the GrenadinesSub-Saharan Africa Sub-Saharan Africa (excluding high income)Sub-Saharan Africa (IDA & IBRD countries)SudanSurinameSwazilandSwedenSwitzerlandSyrian Arab RepublicTajikistanTanzaniaThailandTimor-LesteTogoTongaTrinidad and TobagoTunisiaTurkeyTurkmenistanTurks and Caicos IslandsTuvaluUgandaUkraineUnited Arab EmiratesUnited KingdomUnited StatesUpper middle incomeUruguayVanuatuVenezuela, RBVietnamVirgin Islands (U.S.)WorldYemen, Rep.ZambiaZimbabwe Zeitlinie:
Diese Zeitleiste vorliegt die Graphik ab 1965 J. bis 2016 J. Hungary. Die Angaben bis 1964 J. sind nicht vorhanden. Die Zahl aktueller Beobachtungen nach Daten: 52.
Die Quelle (Bezeichnung):
Kennzahlen der Weltentwicklung
Die Quelle (Einrichtung):
World Bank staff estimates from the Comtrade database maintained by the United Nations Statistics Division.
Kategorien:
Agriculture & Rural Development, Private Sector, Trade
Es wurde aktualisiert:
23 Apr 2017 Jahr
Kennzahlen der Wertänderungen vom Jahr zum Jahr
Minimum:
0.766
1 Jan 2010 Jahr
Maximum:
47.753
1 Jan 1967 Jahr
Zum Datum der Beobachtung
Wert
Absolute Veränderung
Die Veränderung bezüglich dem vorherigen Wert
1 Jan 1965 Jahr
11.965
+11.965
0.0%
1 Jan 1966 Jahr
11.406
-0.559
-4.67%
1 Jan 1967 Jahr
47.753
+36.347
318.68%
1 Jan 1968 Jahr
11.066
-36.686
-76.83%
1 Jan 1969 Jahr
10.724
-0.342
-3.09%
1 Jan 1970 Jahr
9.579
-1.145
-10.68%
1 Jan 1971 Jahr
9.069
-0.509
-5.32%
1 Jan 1972 Jahr
7.247
-1.822
-20.09%
1 Jan 1973 Jahr
7.192
-0.055
-0.76%
1 Jan 1974 Jahr
7.668
+0.476
6.62%
1 Jan 1975 Jahr
7.112
-0.556
-7.25%
1 Jan 1976 Jahr
6.808
-0.304
-4.27%
1 Jan 1977 Jahr
7.18
+0.371
5.45%
1 Jan 1978 Jahr
6.485
-0.695
-9.68%
1 Jan 1979 Jahr
6.701
+0.217
3.34%
1 Jan 1980 Jahr
6.565
-0.136
-2.03%
1 Jan 1981 Jahr
7.07
+0.505
7.69%
1 Jan 1982 Jahr
5.891
-1.179
-16.67%
1 Jan 1983 Jahr
4.876
-1.015
-17.24%
1 Jan 1984 Jahr
5.265
+0.389
7.99%
1 Jan 1985 Jahr
5.514
+0.249
4.73%
1 Jan 1986 Jahr
5.206
-0.308
-5.59%
1 Jan 1987 Jahr
5.253
+0.047
0.91%
1 Jan 1988 Jahr
5.006
-0.247
-4.71%
1 Jan 1989 Jahr
5.404
+0.398
7.96%
1 Jan 1990 Jahr
4.61
-0.794
-14.69%
1 Jan 1991 Jahr
3.641
-0.97
-21.04%
1 Jan 1992 Jahr
3.441
-0.199
-5.48%
1 Jan 1993 Jahr
2.974
-0.467
-13.58%
1 Jan 1994 Jahr
2.6
-0.373
-12.56%
1 Jan 1995 Jahr
2.631
+0.031
1.17%
1 Jan 1996 Jahr
3.02
+0.389
14.8%
1 Jan 1997 Jahr
2.638
-0.382
-12.65%
1 Jan 1998 Jahr
1.991
-0.647
-24.53%
1 Jan 1999 Jahr
1.659
-0.332
-16.68%
1 Jan 2000 Jahr
1.455
-0.203
-12.25%
1 Jan 2001 Jahr
1.463
+0.008
0.53%
1 Jan 2002 Jahr
1.236
-0.227
-15.5%
1 Jan 2003 Jahr
1.277
+0.041
3.3%
1 Jan 2004 Jahr
1.286
+0.008
0.66%
1 Jan 2005 Jahr
1.224
-0.062
-4.81%
1 Jan 2006 Jahr
1.048
-0.176
-14.35%
1 Jan 2007 Jahr
0.889
-0.159
-15.15%
1 Jan 2008 Jahr
0.829
-0.061
-6.83%
1 Jan 2009 Jahr
0.805
-0.023
-2.82%
1 Jan 2010 Jahr
0.766
-0.039
-4.86%
1 Jan 2011 Jahr
0.993
+0.227
29.69%
1 Jan 2012 Jahr
1.281
+0.287
28.94%
1 Jan 2013 Jahr
1.249
-0.032
-2.48%
1 Jan 2014 Jahr
1.207
-0.042
-3.35%
1 Jan 2015 Jahr
1.169
-0.038
-3.15%
1 Jan 2016 Jahr
1.138
-0.031
-2.69%
Bewertung der Länder gemäß mit laufender Statistik nach Jahren


Kommentare: