29
/de/
de
AIzaSyAYiBZKx7MnpbEhh9jyipgxe19OcubqV5w
April 1, 2024
131283
Ethiopia
ETH
true
2
1
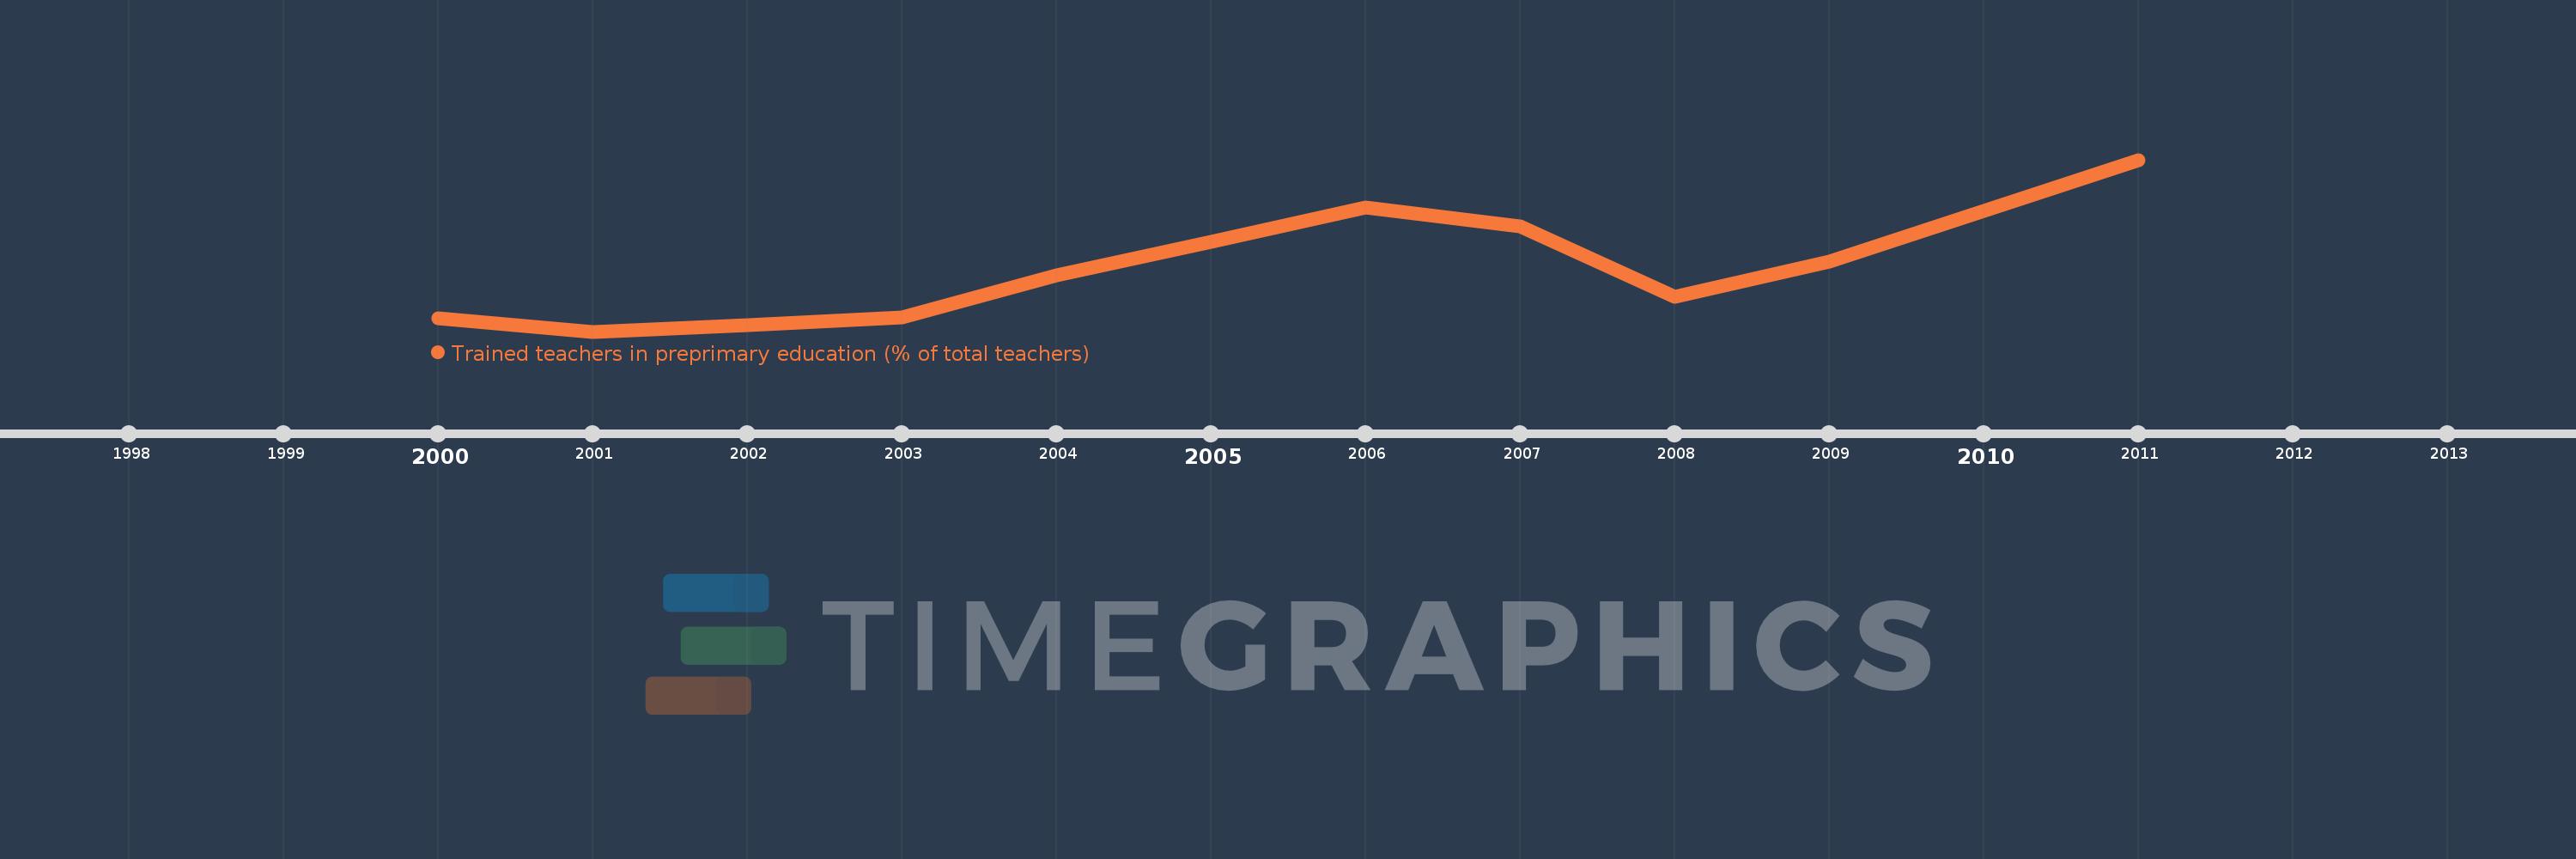
Trained teachers in preprimary education (% of total teachers)
2011,2009,2008,2007,2006,2005,2004,2003,2002,2001,2000
Diese Statistik in anderen Ländern:
Zeitlinie:
Diese Zeitleiste vorliegt die Graphik ab 2000 J. bis 2011 J. Ethiopia. Die Angaben bis 1999 J. sind nicht vorhanden. Die Zahl aktueller Beobachtungen nach Daten: 11.
Die Quelle (Bezeichnung):
Kennzahlen der Weltentwicklung
Die Quelle (Einrichtung):
United Nations Educational, Scientific, and Cultural Organization (UNESCO) Institute for Statistics.
Kategorien:
Education
Es wurde aktualisiert:
23 Apr 2017 Jahr
Kennzahlen der Wertänderungen vom Jahr zum Jahr
Minimum:
61.196
1 Jan 2001 Jahr
Maximum:
85.54
1 Jan 2011 Jahr
Zum Datum der Beobachtung
Wert
Absolute Veränderung
Die Veränderung bezüglich dem vorherigen Wert
1 Jan 2000 Jahr
63.048
+63.048
0.0%
1 Jan 2001 Jahr
61.196
-1.852
-2.94%
1 Jan 2002 Jahr
62.103
+0.908
1.48%
1 Jan 2003 Jahr
63.166
+1.063
1.71%
1 Jan 2004 Jahr
69.133
+5.967
9.45%
1 Jan 2005 Jahr
73.976
+4.843
7.0%
1 Jan 2006 Jahr
78.73
+4.754
6.43%
1 Jan 2007 Jahr
76.124
-2.606
-3.31%
1 Jan 2008 Jahr
66.159
-9.965
-13.09%
1 Jan 2009 Jahr
71.074
+4.915
7.43%
1 Jan 2011 Jahr
85.54
+14.465
20.35%
Bewertung der Länder gemäß mit laufender Statistik nach Jahren


Kommentare: