30
/de/
AIzaSyAYiBZKx7MnpbEhh9jyipgxe19OcubqV5w
April 1, 2024
211198
Nicaragua
NIC
true
2
1
Trained teachers in preprimary education (% of total teachers)
2011,2009,2008,2007,2006,2005,2003,2002,2001,2000,1999
Download
Bibliothek der Globalstatistik →Nicaragua →

Trained teachers in preprimary education (% of total teachers)

Diese Statistik in anderen Ländern:

AndorraAngolaAntigua and BarbudaArab WorldArmeniaArubaAzerbaijanBahamas, TheBahrainBarbadosBelarusBelizeBeninBermudaBhutanBoliviaBotswanaBritish Virgin IslandsBrunei DarussalamBurkina FasoBurundiCabo VerdeCambodiaCameroonCaribbean small statesCayman IslandsChadColombiaCongo, Dem. Rep.Congo, Rep.Costa RicaCote d'IvoireCroatiaCubaDjiboutiDominicaDominican RepublicEcuadorEgypt, Arab Rep.El SalvadorEritreaEthiopiaFragile and conflict affected situationsGambia, TheGeorgiaGhanaGibraltarGrenadaGuineaGuinea-BissauGuyanaHeavily indebted poor countries (HIPC)HondurasIDA blendIDA onlyIDA totalIran, Islamic Rep.IraqKazakhstanKenyaKuwaitKyrgyz RepublicLao PDRLatin America & Caribbean Latin America & Caribbean (excluding high income)Latin America & the Caribbean (IDA & IBRD countries)Least developed countries: UN classificationLebanonLiberiaLow incomeMacao SAR, ChinaMadagascarMalaysiaMaldivesMaliMarshall IslandsMauritaniaMauritiusMexicoMiddle East & North AfricaMiddle East & North Africa (excluding high income)Middle East & North Africa (IDA & IBRD countries)MoldovaMongoliaMoroccoMyanmarNamibiaNauruNepalNicaraguaNigerOmanOther small statesPacific island small statesPanamaParaguayPre-demographic dividendQatarRwandaSamoaSao Tome and PrincipeSaudi ArabiaSenegalSerbiaSeychellesSierra LeoneSmall statesSolomon IslandsSouth AfricaSouth SudanSt. Kitts and NevisSt. LuciaSt. Vincent and the GrenadinesSub-Saharan Africa Sub-Saharan Africa (excluding high income)Sub-Saharan Africa (IDA & IBRD countries)SurinameSwazilandSyrian Arab RepublicTajikistanTanzaniaTogoTongaTrinidad and TobagoTunisiaTuvaluUnited Arab EmiratesUzbekistanVanuatuVietnamWest Bank and GazaZimbabwe

Zeitlinie:

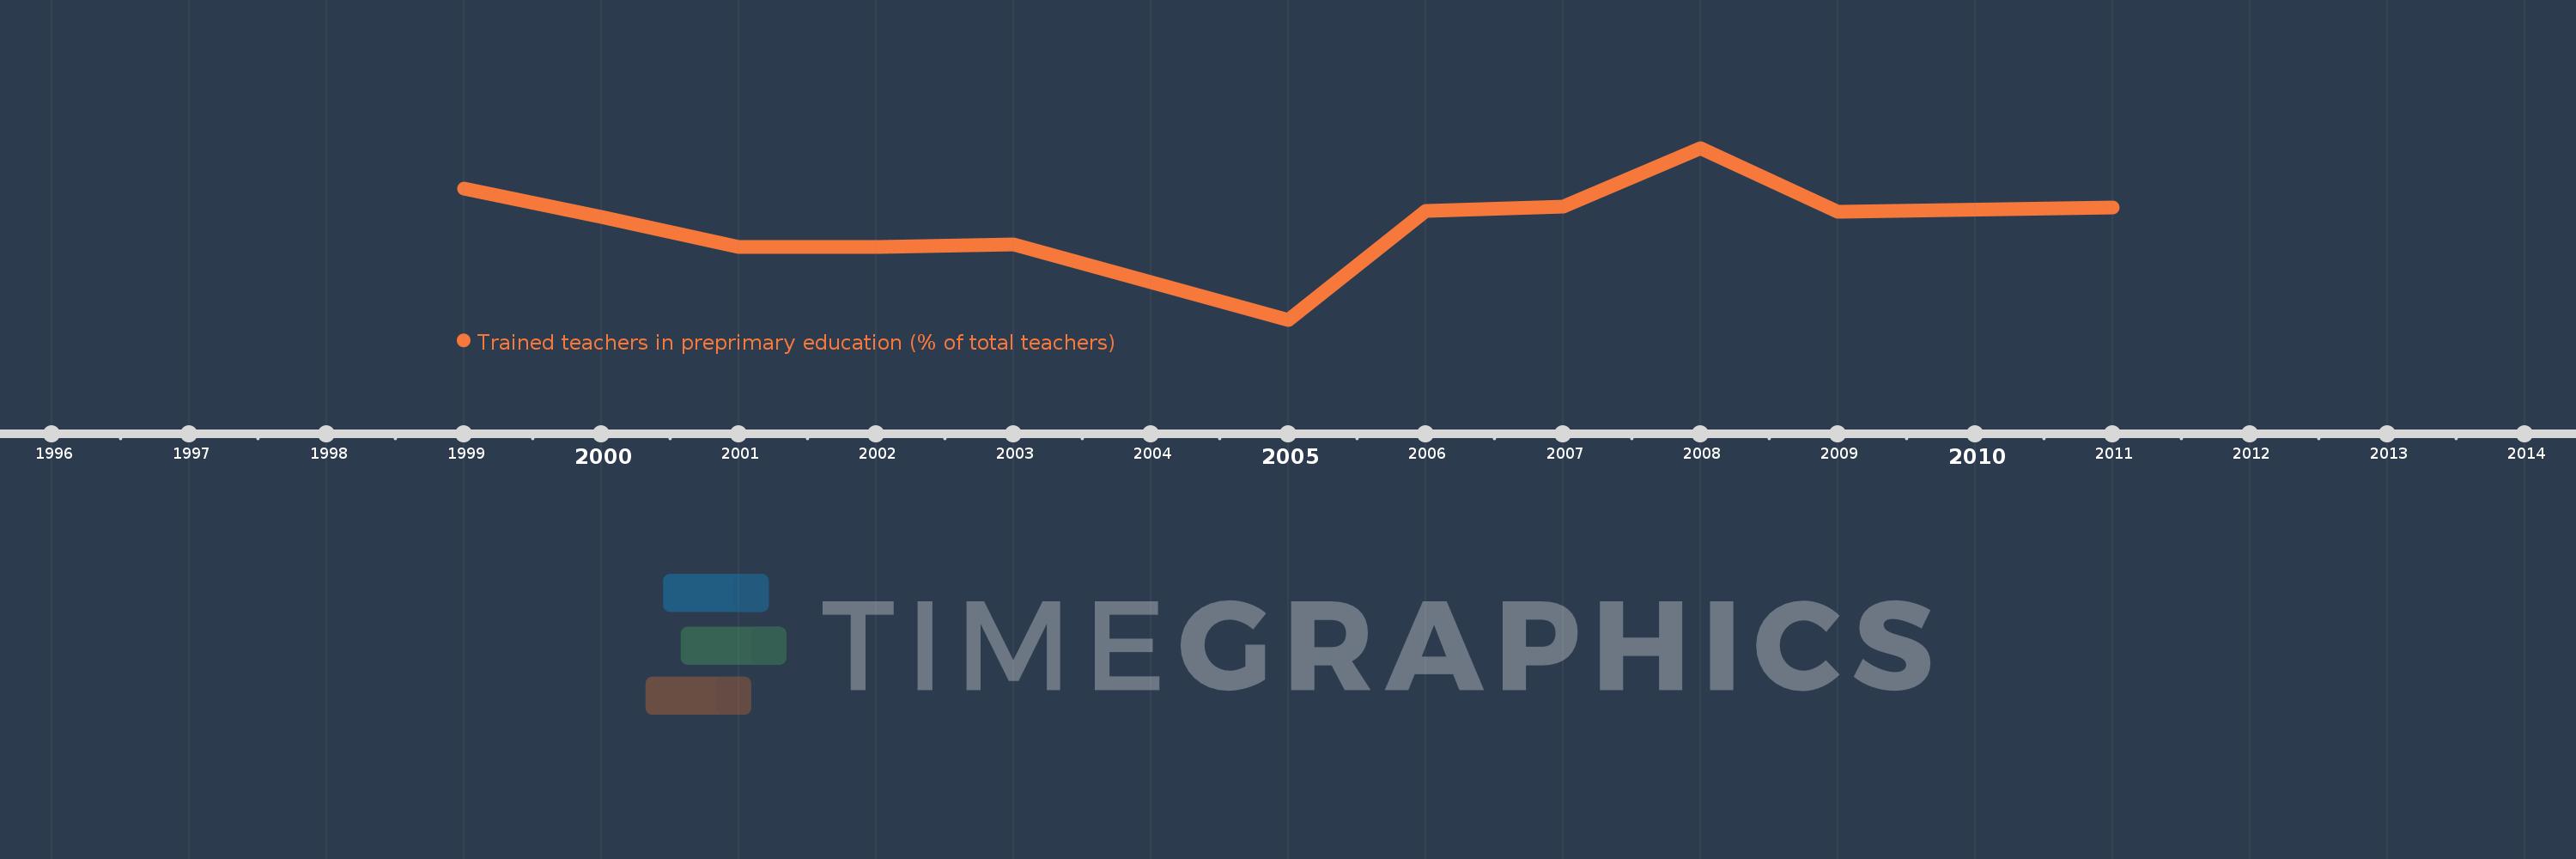
Diese Zeitleiste vorliegt die Graphik ab 1999 J. bis 2011 J. Nicaragua. Die Angaben bis 1998 J. sind nicht vorhanden. Die Zahl aktueller Beobachtungen nach Daten: 11.

Die Quelle (Bezeichnung):

Kennzahlen der Weltentwicklung

Die Quelle (Einrichtung):

United Nations Educational, Scientific, and Cultural Organization (UNESCO) Institute for Statistics.

Kategorien:

Education

Es wurde aktualisiert:

23 Apr 2017 Jahr

Kennzahlen der Wertänderungen vom Jahr zum Jahr

im Durchschnitt:
31.811
Minimum:
22.203
1 Jan 2005 Jahr
Maximum:
39.225
1 Jan 2008 Jahr
Zum Datum der Beobachtung
Wert
Absolute Veränderung
Die Veränderung bezüglich dem vorherigen Wert
1 Jan 1999 Jahr
35.193
+35.193
0.0%
1 Jan 2000 Jahr
32.396
-2.798
-7.95%
1 Jan 2001 Jahr
29.396
-2.999
-9.26%
1 Jan 2002 Jahr
29.372
-0.024
-0.08%
1 Jan 2003 Jahr
29.642
+0.27
0.92%
1 Jan 2005 Jahr
22.203
-7.439
-25.1%
1 Jan 2006 Jahr
32.958
+10.755
48.44%
1 Jan 2007 Jahr
33.376
+0.418
1.27%
1 Jan 2008 Jahr
39.225
+5.849
17.52%
1 Jan 2009 Jahr
32.877
-6.348
-16.18%
1 Jan 2011 Jahr
33.288
+0.411
1.25%

Bewertung der Länder gemäß mit laufender Statistik nach Jahren