33
/
AIzaSyB4mHJ5NPEv-XzF7P6NDYXjlkCWaeKw5bc
November 30, 2025
99612
Cameroon
CMR
true
2
1
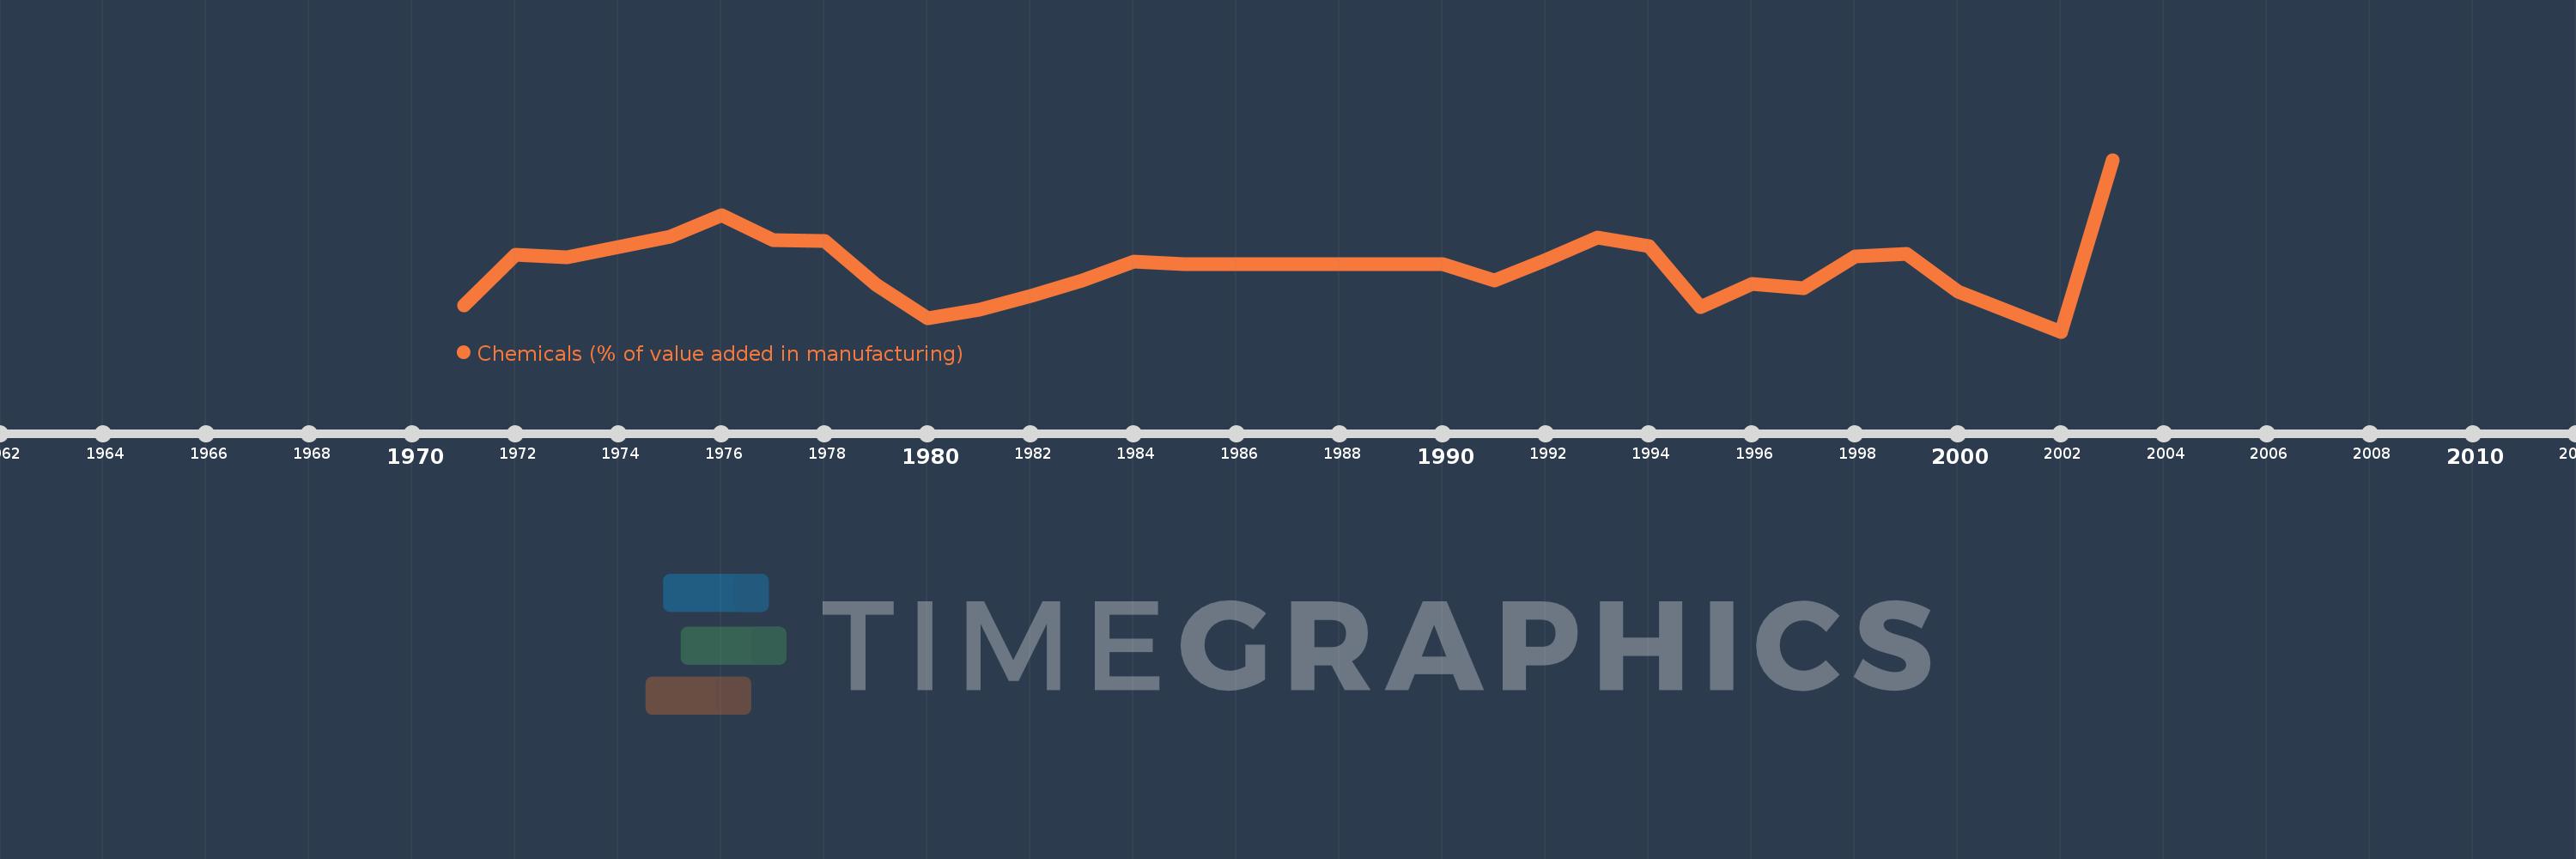
Chemicals (% of value added in manufacturing)
2003,2002,2000,1999,1998,1997,1996,1995,1994,1993,1992,1991,1990,1985,1984,1983,1982,1981,1980,1979,1978,1977,1976,1975,1973,1972,1971