33
/
AIzaSyB4mHJ5NPEv-XzF7P6NDYXjlkCWaeKw5bc
November 30, 2025
95859
Burundi
BDI
true
2
1
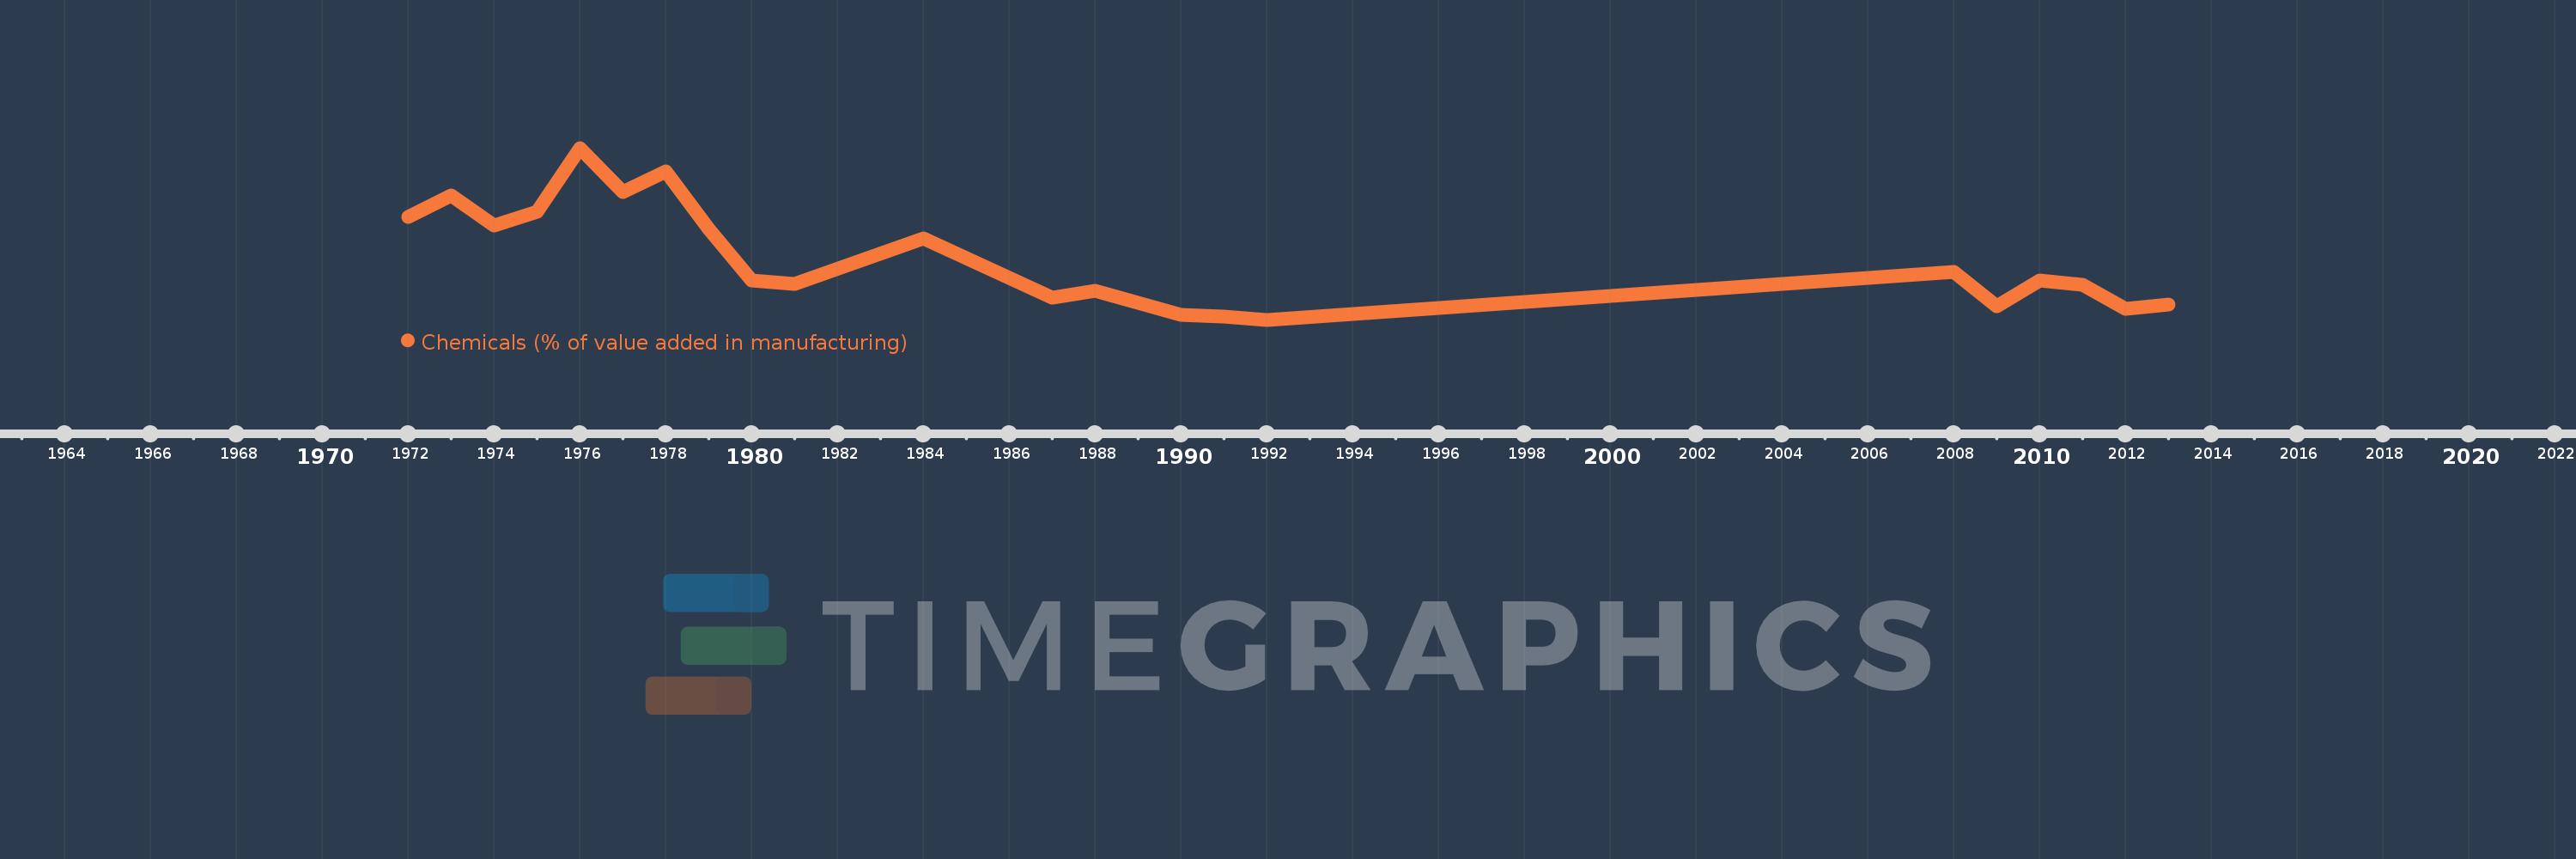
Chemicals (% of value added in manufacturing)
2013,2012,2011,2010,2009,2008,1992,1991,1990,1989,1988,1987,1984,1981,1980,1979,1978,1977,1976,1975,1974,1973,1972