33
/
AIzaSyB4mHJ5NPEv-XzF7P6NDYXjlkCWaeKw5bc
November 30, 2025
98958
Cambodia
KHM
true
2
1
Net financial flows, IDA (NFL, current US$)
2016,2015,2014,2013,2012,2011,2010,2009,2008,2007,2006,2005,2004,2003,2002,2001,2000,1999,1998,1997,1996,1995
Create a timeline
Public Timelines
For education
For educational institutions
For teachers
For students
Cabinet
For educational institutions
For teachers
For students
Open cabinet
FAQ
Close
Create a timeline
Public timelines
FAQ
About & Feedback
Terms
Privacy
FAQ
Support 24/7
Cabinet
Get premium
Donate
Download
Global statistics library
→
Cambodia
→
Net financial flows, IDA (NFL, current US$)
This statistics in other country:
Afghanistan
Albania
Angola
Armenia
Azerbaijan
Bangladesh
Benin
Bhutan
Bolivia
Bosnia and Herzegovina
Botswana
Burkina Faso
Burundi
Cabo Verde
Cambodia
Cameroon
Caribbean small states
Central African Republic
Central Europe and the Baltics
Chad
China
Colombia
Comoros
Congo, Dem. Rep.
Congo, Rep.
Costa Rica
Cote d'Ivoire
Croatia
Czech Republic
Djibouti
Dominica
Dominican Republic
Early-demographic dividend
East Asia & Pacific
East Asia & Pacific (excluding high income)
East Asia & Pacific (IDA & IBRD countries)
Ecuador
Egypt, Arab Rep.
El Salvador
Equatorial Guinea
Eritrea
Estonia
Ethiopia
Europe & Central Asia
Europe & Central Asia (excluding high income)
Europe & Central Asia (IDA & IBRD countries)
Fragile and conflict affected situations
Gambia, The
Georgia
Ghana
Greece
Grenada
Guinea
Guinea-Bissau
Guyana
Haiti
Honduras
Hungary
IBRD only
IDA & IBRD total
IDA blend
IDA only
IDA total
India
Indonesia
Jordan
Kenya
Korea, Rep.
Kosovo
Kyrgyz Republic
Lao PDR
Late-demographic dividend
Latin America & Caribbean
Latin America & Caribbean (excluding high income)
Latin America & the Caribbean (IDA & IBRD countries)
Lesotho
Liberia
Low & middle income
Low income
Lower middle income
Macedonia, FYR
Madagascar
Malawi
Maldives
Mali
Mauritania
Mauritius
Middle East & North Africa
Middle East & North Africa (excluding high income)
Middle East & North Africa (IDA & IBRD countries)
Middle income
Moldova
Mongolia
Montenegro
Morocco
Mozambique
Myanmar
Nepal
Nicaragua
Niger
Nigeria
Oman
Other small states
Pacific island small states
Pakistan
Papua New Guinea
Paraguay
Philippines
Poland
Pre-demographic dividend
Rwanda
Samoa
Sao Tome and Principe
Senegal
Serbia
Seychelles
Sierra Leone
Slovak Republic
Slovenia
Small states
Solomon Islands
Somalia
South Asia
South Asia (IDA & IBRD)
Sri Lanka
St. Kitts and Nevis
St. Lucia
St. Vincent and the Grenadines
Sub-Saharan Africa
Sub-Saharan Africa (excluding high income)
Sub-Saharan Africa (IDA & IBRD countries)
Sudan
Swaziland
Syrian Arab Republic
Tajikistan
Tanzania
Thailand
Togo
Tonga
Trinidad and Tobago
Tunisia
Turkey
Uganda
Upper middle income
Uzbekistan
Vanuatu
Vietnam
Yemen, Rep.
Zambia
Zimbabwe
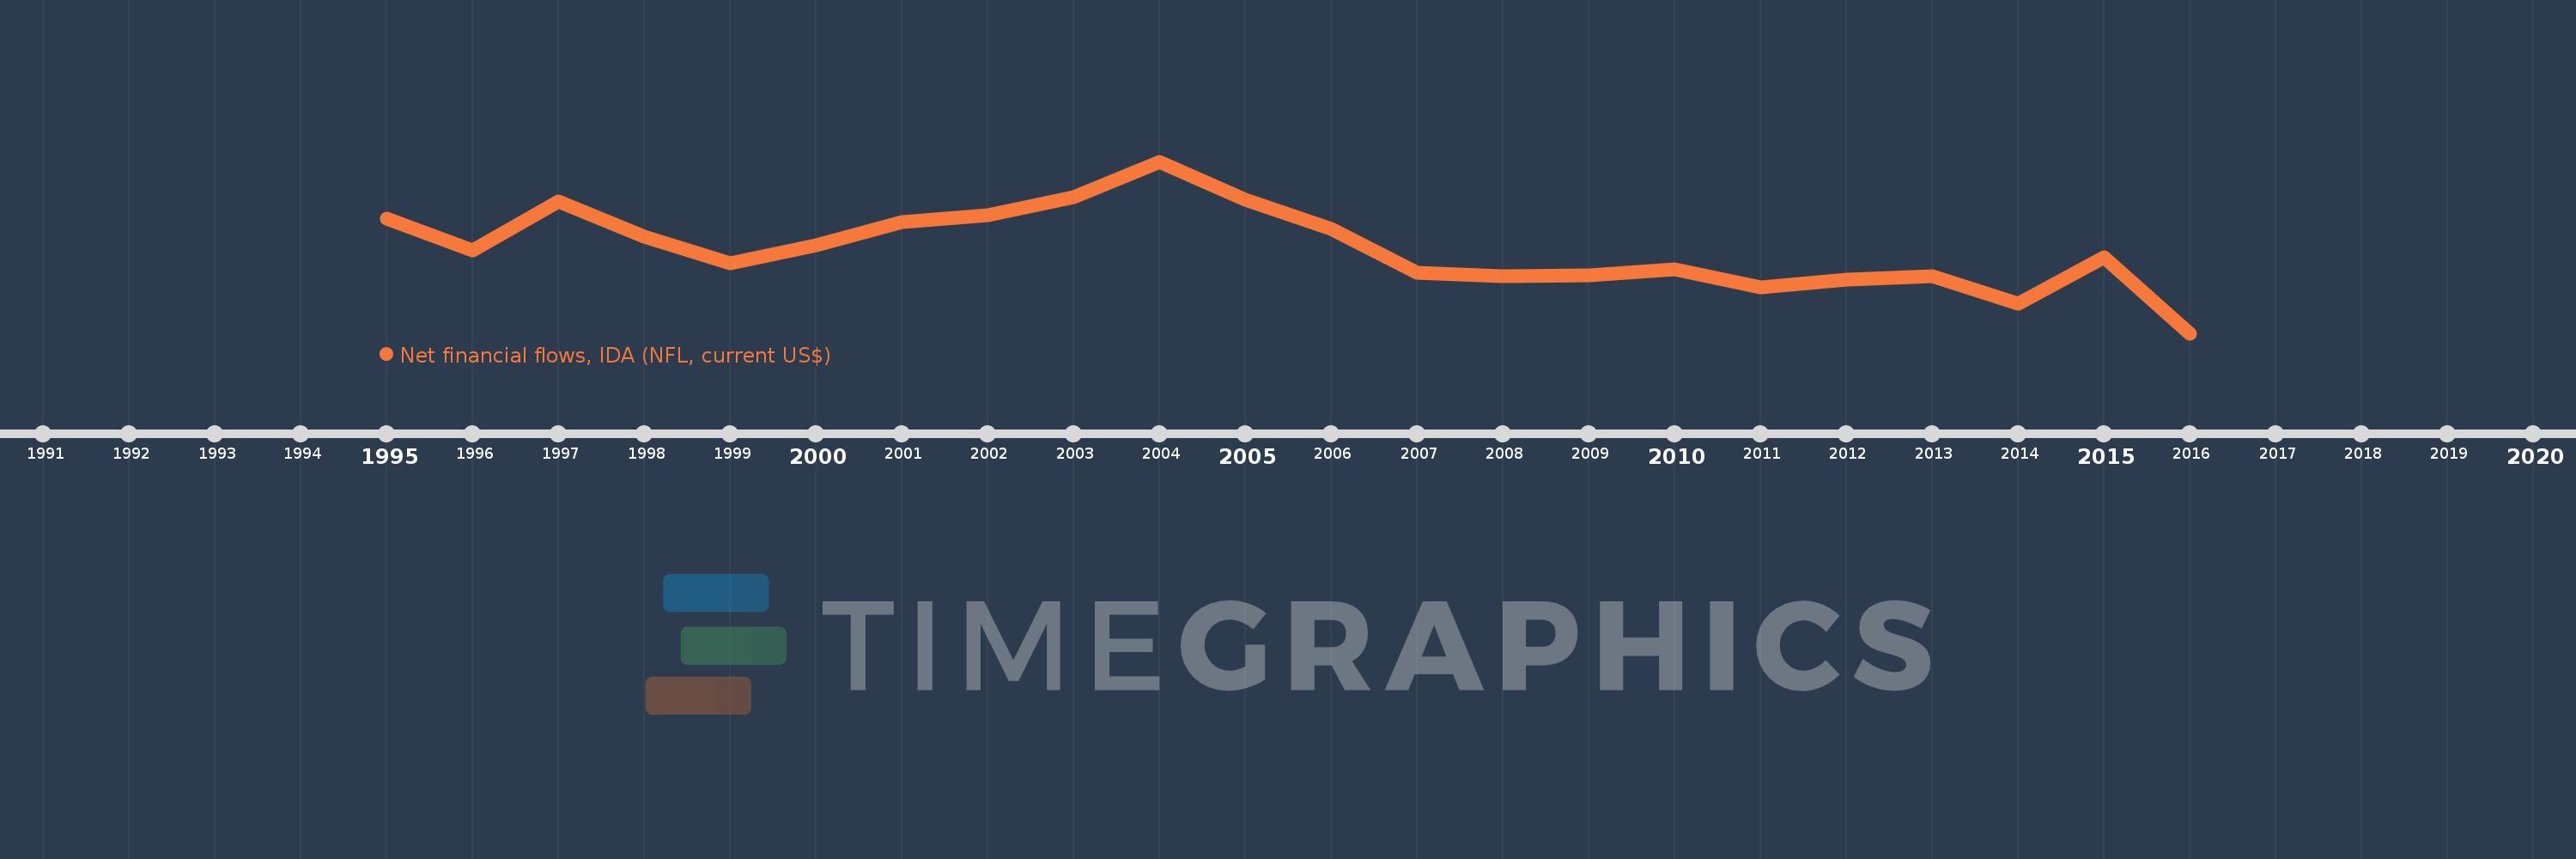
Timeline:
This timeline shows a graph from
1995
to
2016
of Cambodia. No data until
1994
. Number of actual observations by date:
22
.
Source name:
World Development Indicators
Source organization:
World Bank, International Debt Statistics.
Categories, topics:
External Debt
Last updated:
apr 23, 2017
Indicators value changes by year
Meaning:
25.347 mln
Minimum:
-10.806 mln
jan 1, 2016
Maximum:
62.56 mln
jan 1, 2004
At the date of observation
Value
Absolute change
Change from the previous value
jan 1, 1995
38.229 mln
+38.229 mln
0.0%
jan 1, 1996
24.623 mln
-13.606 mln
-35.59%
jan 1, 1997
45.622 mln
+20.999 mln
85.28%
jan 1, 1998
30.409 mln
-15.213 mln
-33.35%
jan 1, 1999
19.181 mln
-11.228 mln
-36.92%
jan 1, 2000
26.783 mln
+7.602 mln
39.63%
jan 1, 2001
36.569 mln
+9.786 mln
36.54%
jan 1, 2002
39.55 mln
+2.981 mln
8.15%
jan 1, 2003
47.246 mln
+7.696 mln
19.46%
jan 1, 2004
62.56 mln
+15.314 mln
32.41%
jan 1, 2005
46.321 mln
-16.239 mln
-25.96%
jan 1, 2006
33.665 mln
-12.656 mln
-27.32%
jan 1, 2007
15.078 mln
-18.587 mln
-55.21%
jan 1, 2008
13.649 mln
-1.429 mln
-9.48%
jan 1, 2009
14.085 mln
+436.0K
3.19%
jan 1, 2010
16.383 mln
+2.298 mln
16.32%
jan 1, 2011
8.961 mln
-7.422 mln
-45.3%
jan 1, 2012
12.224 mln
+3.263 mln
36.41%
jan 1, 2013
13.623 mln
+1.399 mln
11.44%
jan 1, 2014
1.987 mln
-11.636 mln
-85.41%
jan 1, 2015
21.697 mln
+19.71 mln
991.95%
jan 1, 2016
-10.806 mln
-32.503 mln
-149.8%
Ranking of countries by current statistics by years
About & Feedback
Terms
Privacy
FAQ
Support 24/7
Cabinet
Get premium
Donate
The service accepts bank transfer (ACH, Wire) or cards (Visa, MasterCard, etc). Processed by Stripe.
Secured with SSL