33
/
AIzaSyB4mHJ5NPEv-XzF7P6NDYXjlkCWaeKw5bc
November 30, 2025
88905
Bosnia and Herzegovina
BIH
true
2
1
Net financial flows, IDA (NFL, current US$)
2016,2015,2014,2013,2012,2011,2010,2009,2008,2007,2006,2005,2004,2003,2002,2001,2000,1999,1998,1997
Create a timeline
Public Timelines
For education
For educational institutions
For teachers
For students
Cabinet
For educational institutions
For teachers
For students
Open cabinet
FAQ
Close
Create a timeline
Public timelines
FAQ
About & Feedback
Terms
Privacy
FAQ
Support 24/7
Cabinet
Get premium
Donate
Download
Global statistics library
→
Bosnia and Herzegovina
→
Net financial flows, IDA (NFL, current US$)
This statistics in other country:
Afghanistan
Albania
Angola
Armenia
Azerbaijan
Bangladesh
Benin
Bhutan
Bolivia
Bosnia and Herzegovina
Botswana
Burkina Faso
Burundi
Cabo Verde
Cambodia
Cameroon
Caribbean small states
Central African Republic
Central Europe and the Baltics
Chad
China
Colombia
Comoros
Congo, Dem. Rep.
Congo, Rep.
Costa Rica
Cote d'Ivoire
Croatia
Czech Republic
Djibouti
Dominica
Dominican Republic
Early-demographic dividend
East Asia & Pacific
East Asia & Pacific (excluding high income)
East Asia & Pacific (IDA & IBRD countries)
Ecuador
Egypt, Arab Rep.
El Salvador
Equatorial Guinea
Eritrea
Estonia
Ethiopia
Europe & Central Asia
Europe & Central Asia (excluding high income)
Europe & Central Asia (IDA & IBRD countries)
Fragile and conflict affected situations
Gambia, The
Georgia
Ghana
Greece
Grenada
Guinea
Guinea-Bissau
Guyana
Haiti
Honduras
Hungary
IBRD only
IDA & IBRD total
IDA blend
IDA only
IDA total
India
Indonesia
Jordan
Kenya
Korea, Rep.
Kosovo
Kyrgyz Republic
Lao PDR
Late-demographic dividend
Latin America & Caribbean
Latin America & Caribbean (excluding high income)
Latin America & the Caribbean (IDA & IBRD countries)
Lesotho
Liberia
Low & middle income
Low income
Lower middle income
Macedonia, FYR
Madagascar
Malawi
Maldives
Mali
Mauritania
Mauritius
Middle East & North Africa
Middle East & North Africa (excluding high income)
Middle East & North Africa (IDA & IBRD countries)
Middle income
Moldova
Mongolia
Montenegro
Morocco
Mozambique
Myanmar
Nepal
Nicaragua
Niger
Nigeria
Oman
Other small states
Pacific island small states
Pakistan
Papua New Guinea
Paraguay
Philippines
Poland
Pre-demographic dividend
Rwanda
Samoa
Sao Tome and Principe
Senegal
Serbia
Seychelles
Sierra Leone
Slovak Republic
Slovenia
Small states
Solomon Islands
Somalia
South Asia
South Asia (IDA & IBRD)
Sri Lanka
St. Kitts and Nevis
St. Lucia
St. Vincent and the Grenadines
Sub-Saharan Africa
Sub-Saharan Africa (excluding high income)
Sub-Saharan Africa (IDA & IBRD countries)
Sudan
Swaziland
Syrian Arab Republic
Tajikistan
Tanzania
Thailand
Togo
Tonga
Trinidad and Tobago
Tunisia
Turkey
Uganda
Upper middle income
Uzbekistan
Vanuatu
Vietnam
Yemen, Rep.
Zambia
Zimbabwe
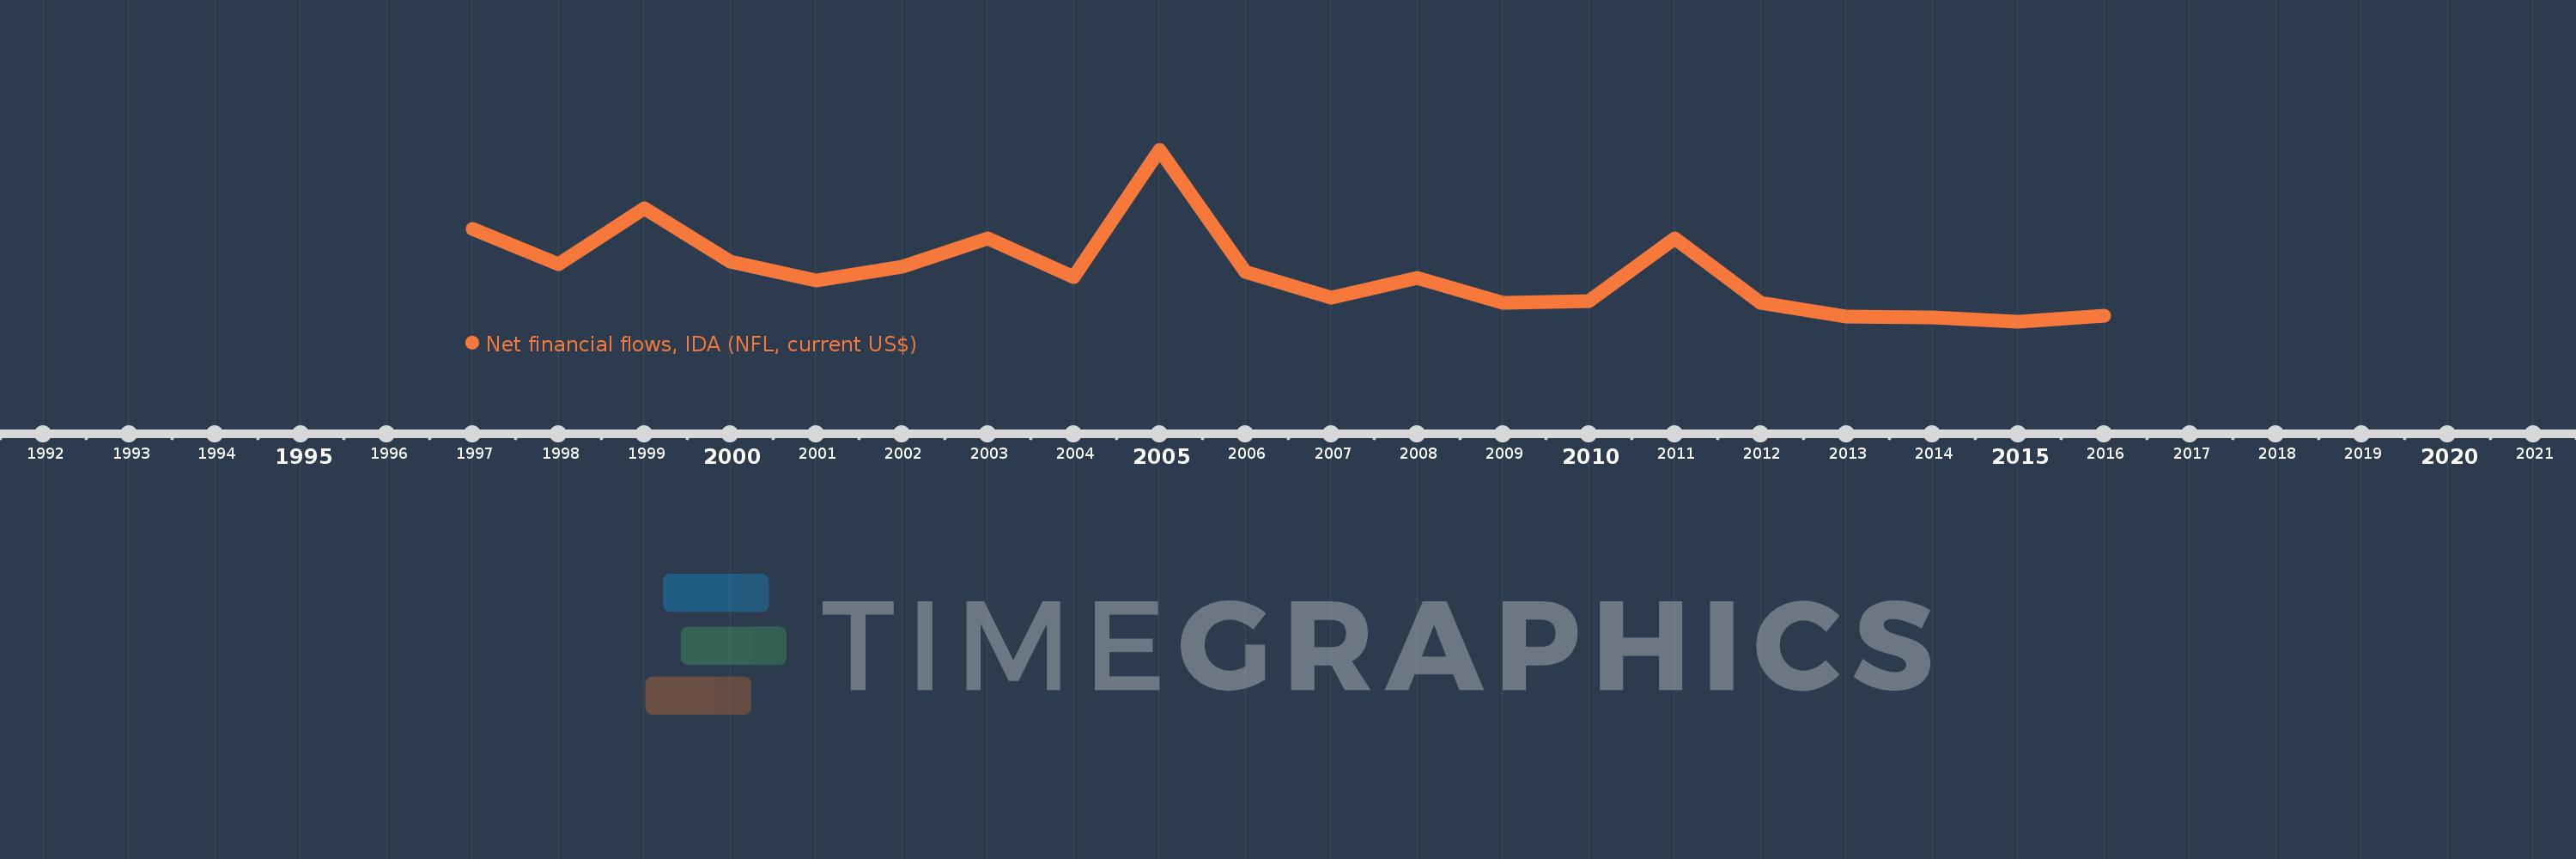
Timeline:
This timeline shows a graph from
1997
to
2016
of Bosnia and Herzegovina. No data until
1996
. Number of actual observations by date:
20
.
Source name:
World Development Indicators
Source organization:
World Bank, International Debt Statistics.
Categories, topics:
External Debt
Last updated:
apr 23, 2017
Indicators value changes by year
Meaning:
54.952 mln
Minimum:
-8.054 mln
jan 1, 2015
Maximum:
208.546 mln
jan 1, 2005
At the date of observation
Value
Absolute change
Change from the previous value
jan 1, 1997
109.559 mln
+109.559 mln
0.0%
jan 1, 1998
65.203 mln
-44.356 mln
-40.49%
jan 1, 1999
134.857 mln
+69.654 mln
106.83%
jan 1, 2000
67.956 mln
-66.901 mln
-49.61%
jan 1, 2001
44.108 mln
-23.848 mln
-35.09%
jan 1, 2002
61.736 mln
+17.628 mln
39.97%
jan 1, 2003
96.844 mln
+35.108 mln
56.87%
jan 1, 2004
48.193 mln
-48.651 mln
-50.24%
jan 1, 2005
208.546 mln
+160.353 mln
332.73%
jan 1, 2006
55.591 mln
-152.955 mln
-73.34%
jan 1, 2007
22.866 mln
-32.725 mln
-58.87%
jan 1, 2008
47.963 mln
+25.097 mln
109.76%
jan 1, 2009
16.534 mln
-31.429 mln
-65.53%
jan 1, 2010
18.022 mln
+1.488 mln
9.0%
jan 1, 2011
97.193 mln
+79.171 mln
439.3%
jan 1, 2012
16.212 mln
-80.981 mln
-83.32%
jan 1, 2013
-1.454 mln
-17.666 mln
-108.97%
jan 1, 2014
-2.318 mln
-864.0K
59.42%
jan 1, 2015
-8.054 mln
-5.736 mln
247.45%
jan 1, 2016
-511.0K
+7.543 mln
-93.66%
Ranking of countries by current statistics by years
About & Feedback
Terms
Privacy
FAQ
Support 24/7
Cabinet
Get premium
Donate
The service accepts bank transfer (ACH, Wire) or cards (Visa, MasterCard, etc). Processed by Stripe.
Secured with SSL