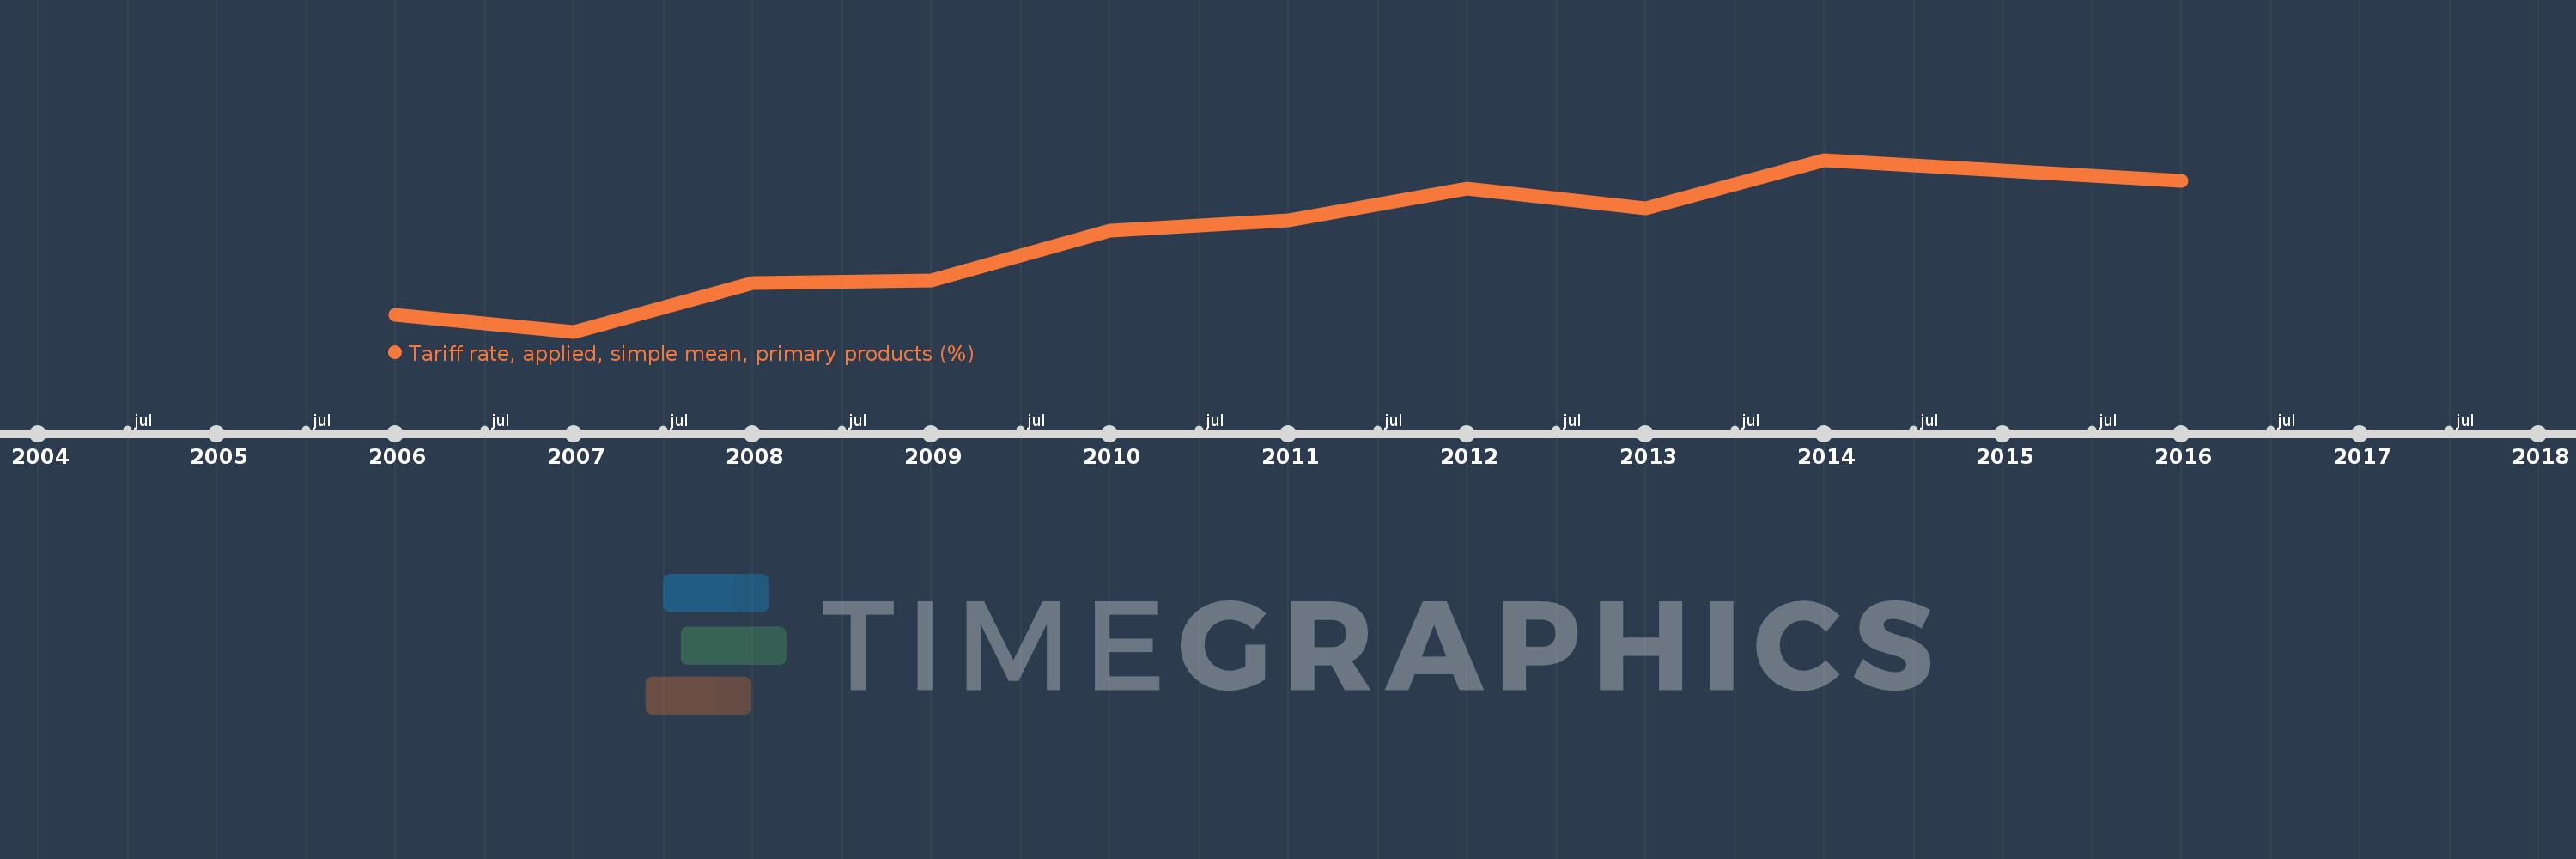
This timeline shows a graph from 2006 to 2016 of Cabo Verde. No data until 2005. Number of actual observations by date: 10.
Source name:
World Development Indicators
Source organization:
World Bank staff estimates using the World Integrated Trade Solution system, based on data from United Nations Conference on Trade and Development's Trade Analysis and Information System (TRAINS) database and the World Trade Organization’s (WTO) Integrated Data Base (IDB) and Consolidated Tariff Schedules (CTS) database.
Categories, topics:
Private Sector, Trade
Last updated:
apr 23, 2017
Indicators value changes by year
Meaning:
16.089
Minimum:
15.48
jan 1, 2007
Maximum:
16.62
jan 1, 2014
At the date of observation
Value
Absolute change
Change from the previous value
jan 1, 2006
15.59
+15.59
0.0%
jan 1, 2007
15.48
-0.11
-0.71%
jan 1, 2008
15.8
+0.32
2.07%
jan 1, 2009
15.82
+0.02
0.13%
jan 1, 2010
16.15
+0.33
2.09%
jan 1, 2011
16.22
+0.07
0.43%
jan 1, 2012
16.43
+0.21
1.29%
jan 1, 2013
16.3
-0.13
-0.79%
jan 1, 2014
16.62
+0.32
1.96%
jan 1, 2016
16.48
-0.14
-0.84%
Ranking of countries by current statistics by years