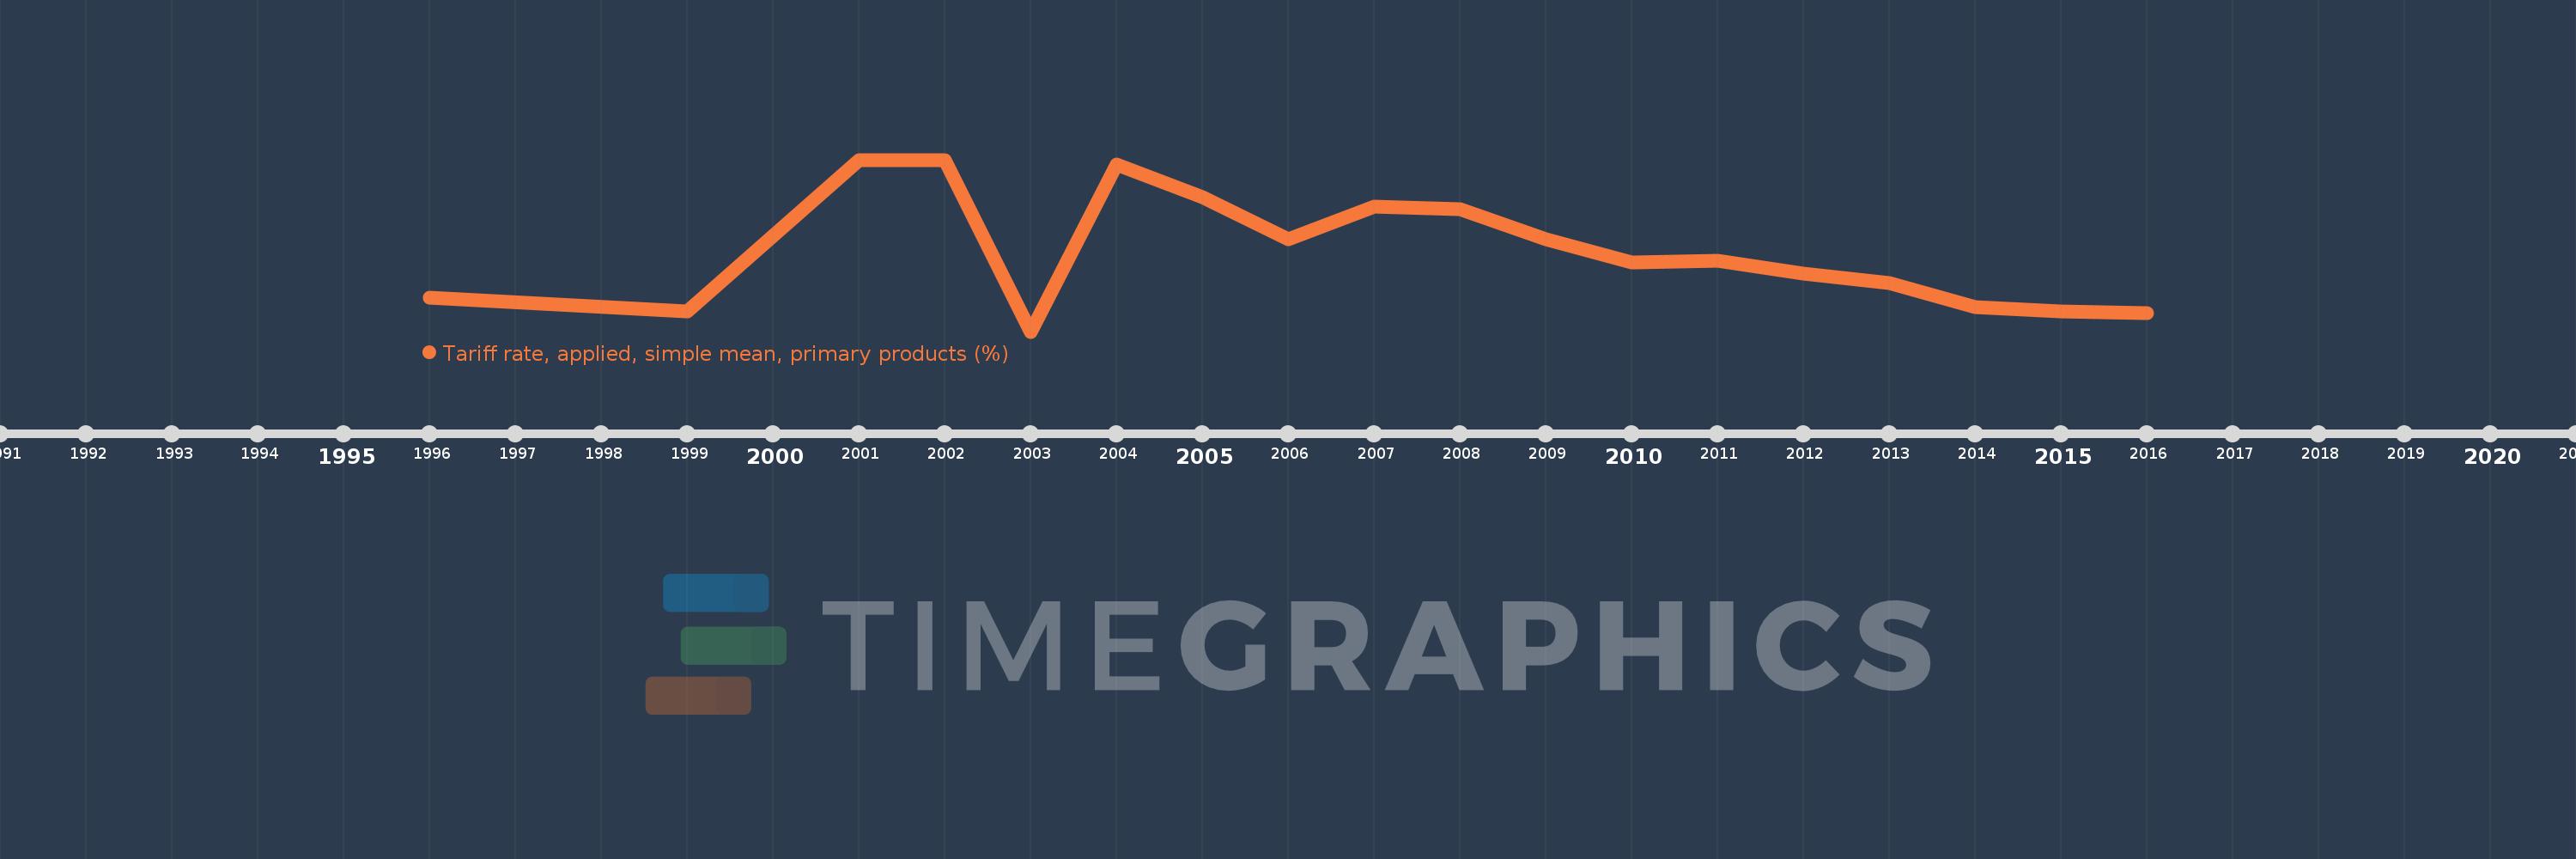
This timeline shows a graph from 1996 to 2016 of Egypt, Arab Rep.. No data until 1995. Number of actual observations by date: 18.
Source name:
World Development Indicators
Source organization:
World Bank staff estimates using the World Integrated Trade Solution system, based on data from United Nations Conference on Trade and Development's Trade Analysis and Information System (TRAINS) database and the World Trade Organization’s (WTO) Integrated Data Base (IDB) and Consolidated Tariff Schedules (CTS) database.
Categories, topics:
Private Sector, Trade
Last updated:
apr 23, 2017
Indicators value changes by year
Meaning:
34.724
Minimum:
19.36
jan 1, 2003
Maximum:
52.34
jan 1, 2001
At the date of observation
Value
Absolute change
Change from the previous value
jan 1, 1996
25.88
+25.88
0.0%
jan 1, 1999
23.3
-2.58
-9.97%
jan 1, 2001
52.34
+29.04
124.64%
jan 1, 2002
52.3
-0.04
-0.08%
jan 1, 2003
19.36
-32.94
-62.98%
jan 1, 2004
51.43
+32.07
165.65%
jan 1, 2005
45.19
-6.24
-12.13%
jan 1, 2006
37.03
-8.16
-18.06%
jan 1, 2007
43.37
+6.34
17.12%
jan 1, 2008
42.9
-0.47
-1.08%
jan 1, 2009
37.05
-5.85
-13.64%
jan 1, 2010
32.63
-4.42
-11.93%
jan 1, 2011
32.89
+0.26
0.8%
jan 1, 2012
30.49
-2.4
-7.3%
jan 1, 2013
28.64
-1.85
-6.07%
jan 1, 2014
24.1
-4.54
-15.85%
jan 1, 2015
23.17
-0.93
-3.86%
jan 1, 2016
22.96
-0.21
-0.91%
Ranking of countries by current statistics by years