33
/
AIzaSyB4mHJ5NPEv-XzF7P6NDYXjlkCWaeKw5bc
November 30, 2025
97938
Cabo Verde
CPV
true
2
1
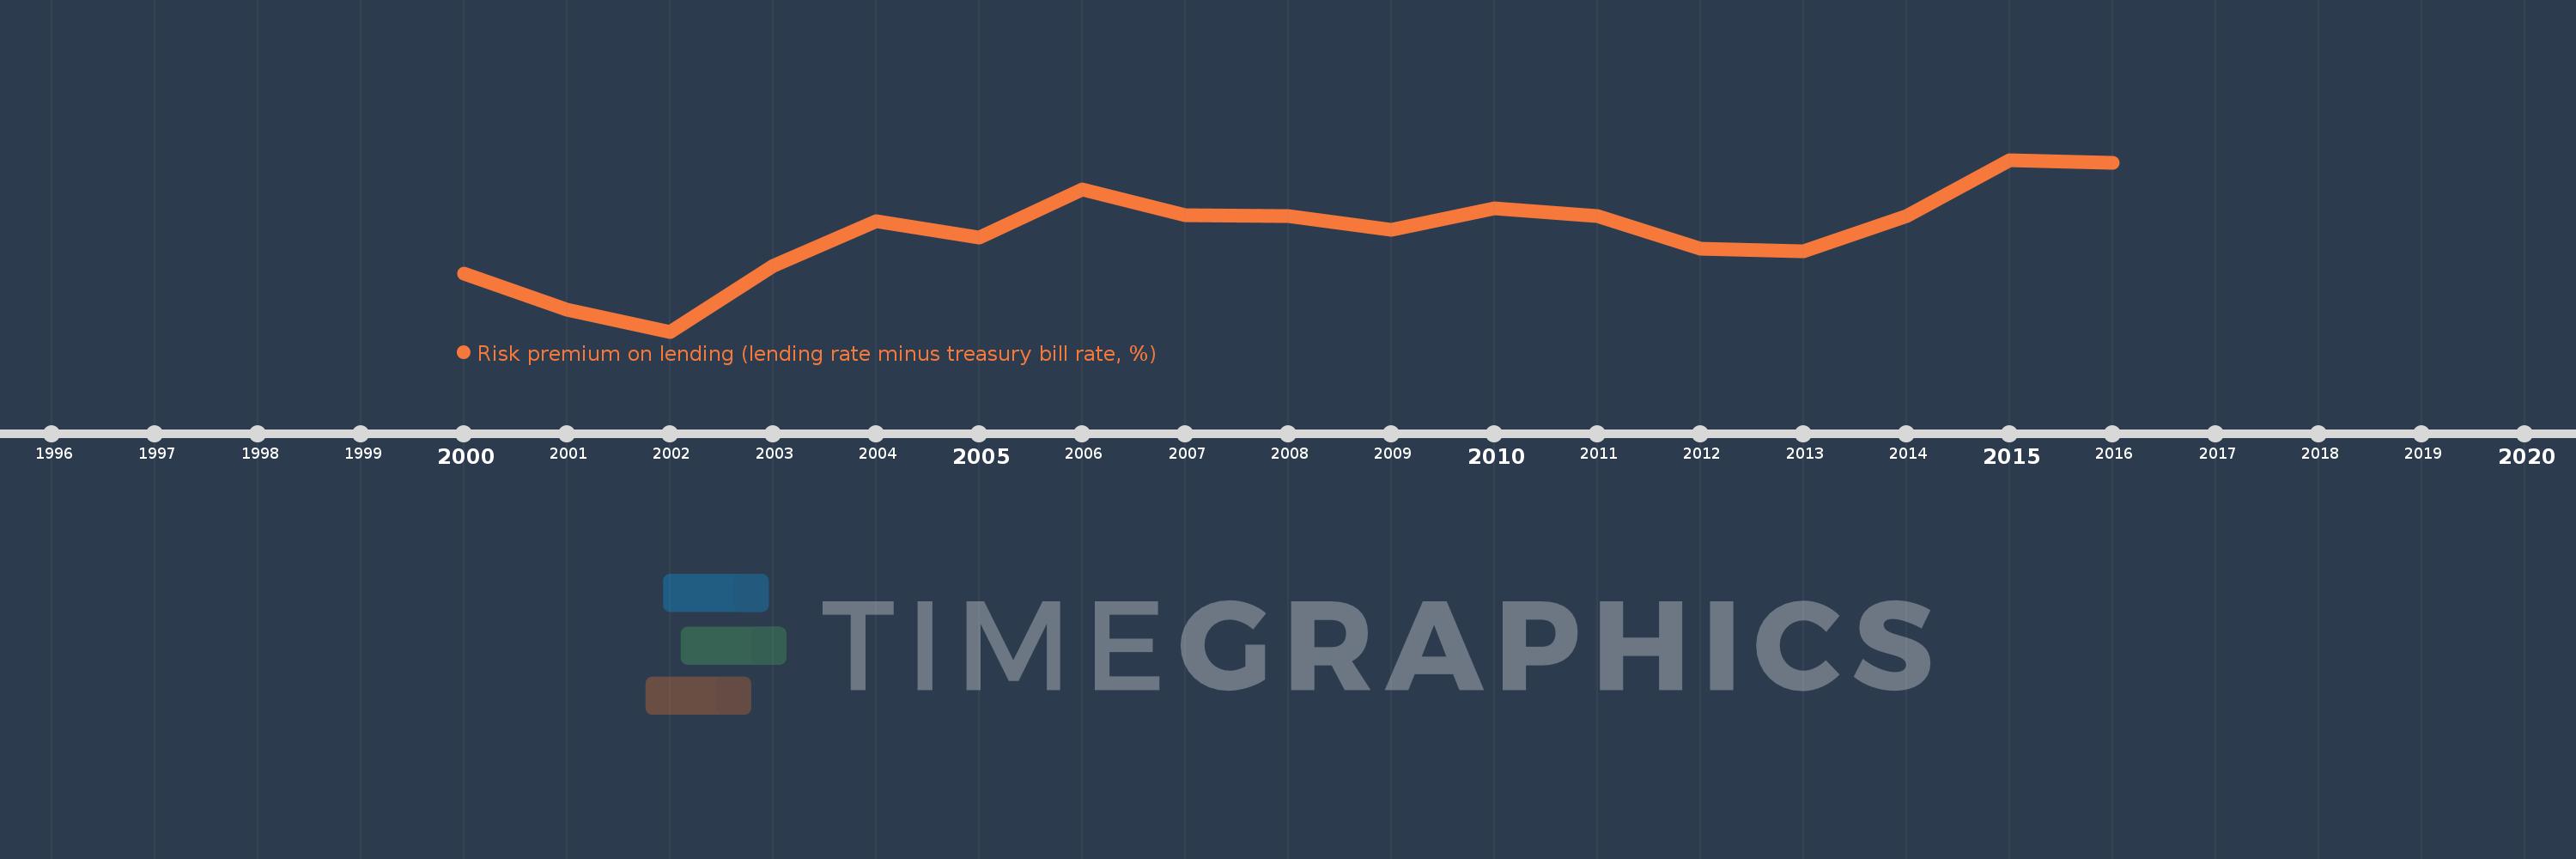
Risk premium on lending (lending rate minus treasury bill rate, %)
2016,2015,2014,2013,2012,2011,2010,2009,2008,2007,2006,2005,2004,2003,2002,2001,2000
Create a timeline
Public Timelines
For education
For educational institutions
For teachers
For students
Cabinet
For educational institutions
For teachers
For students
Open cabinet
FAQ
Close
Create a timeline
Public timelines
FAQ
About & Feedback
Terms
Privacy
FAQ
Support 24/7
Cabinet
Get premium
Donate
Download
Global statistics library
→
Cabo Verde
→
Risk premium on lending (lending rate minus treasury bill rate, %)
This statistics in other country:
Albania
Algeria
Angola
Antigua and Barbuda
Armenia
Australia
Azerbaijan
Bahamas, The
Bahrain
Bangladesh
Barbados
Belgium
Belize
Bolivia
Brazil
Bulgaria
Burundi
Cabo Verde
Canada
Cyprus
Czech Republic
Denmark
Dominica
Egypt, Arab Rep.
Ethiopia
Fiji
France
Gambia, The
Georgia
Germany
Ghana
Greece
Grenada
Guyana
Hong Kong SAR, China
Hungary
Iceland
Iraq
Ireland
Israel
Italy
Jamaica
Japan
Kenya
Kosovo
Kuwait
Kyrgyz Republic
Lao PDR
Latvia
Lebanon
Lesotho
Lithuania
Madagascar
Malawi
Malaysia
Maldives
Malta
Mauritania
Mauritius
Mexico
Moldova
Mongolia
Montenegro
Mozambique
Namibia
Nepal
Netherlands
New Zealand
Nigeria
Papua New Guinea
Philippines
Poland
Portugal
Romania
Russian Federation
Rwanda
Serbia
Seychelles
Sierra Leone
Singapore
Slovenia
Solomon Islands
South Africa
South Sudan
Spain
Sri Lanka
St. Kitts and Nevis
St. Lucia
St. Vincent and the Grenadines
Swaziland
Sweden
Switzerland
Tajikistan
Tanzania
Thailand
Trinidad and Tobago
Uganda
United Kingdom
United States
Uruguay
Vietnam
Yemen, Rep.
Zambia
Zimbabwe
Timeline:
This timeline shows a graph from
2000
to
2016
of Cabo Verde. No data until
1999
. Number of actual observations by date:
17
.
Source name:
World Development Indicators
Source organization:
International Monetary Fund, International Financial Statistics database.
Categories, topics:
Financial Sector
Last updated:
apr 23, 2017
Indicators value changes by year
Meaning:
6.48
Minimum:
2.523
jan 1, 2002
Maximum:
9.388
jan 1, 2015
At the date of observation
Value
Absolute change
Change from the previous value
jan 1, 2000
4.844
+4.844
0.0%
jan 1, 2001
3.411
-1.434
-29.59%
jan 1, 2002
2.523
-0.887
-26.02%
jan 1, 2003
5.137
+2.614
103.6%
jan 1, 2004
6.917
+1.78
34.65%
jan 1, 2005
6.269
-0.648
-9.37%
jan 1, 2006
8.218
+1.948
31.08%
jan 1, 2007
7.16
-1.058
-12.87%
jan 1, 2008
7.142
-0.018
-0.25%
jan 1, 2009
6.581
-0.56
-7.85%
jan 1, 2010
7.456
+0.874
13.28%
jan 1, 2011
7.151
-0.304
-4.08%
jan 1, 2012
5.852
-1.299
-18.16%
jan 1, 2013
5.723
-0.129
-2.21%
jan 1, 2014
7.133
+1.41
24.63%
jan 1, 2015
9.388
+2.255
31.62%
jan 1, 2016
9.26
-0.128
-1.37%
Ranking of countries by current statistics by years
About & Feedback
Terms
Privacy
FAQ
Support 24/7
Cabinet
Get premium
Donate
The service accepts bank transfer (ACH, Wire) or cards (Visa, MasterCard, etc). Processed by Stripe.
Secured with SSL