33
/
AIzaSyB4mHJ5NPEv-XzF7P6NDYXjlkCWaeKw5bc
November 30, 2025
172177
Kuwait
KWT
true
2
1
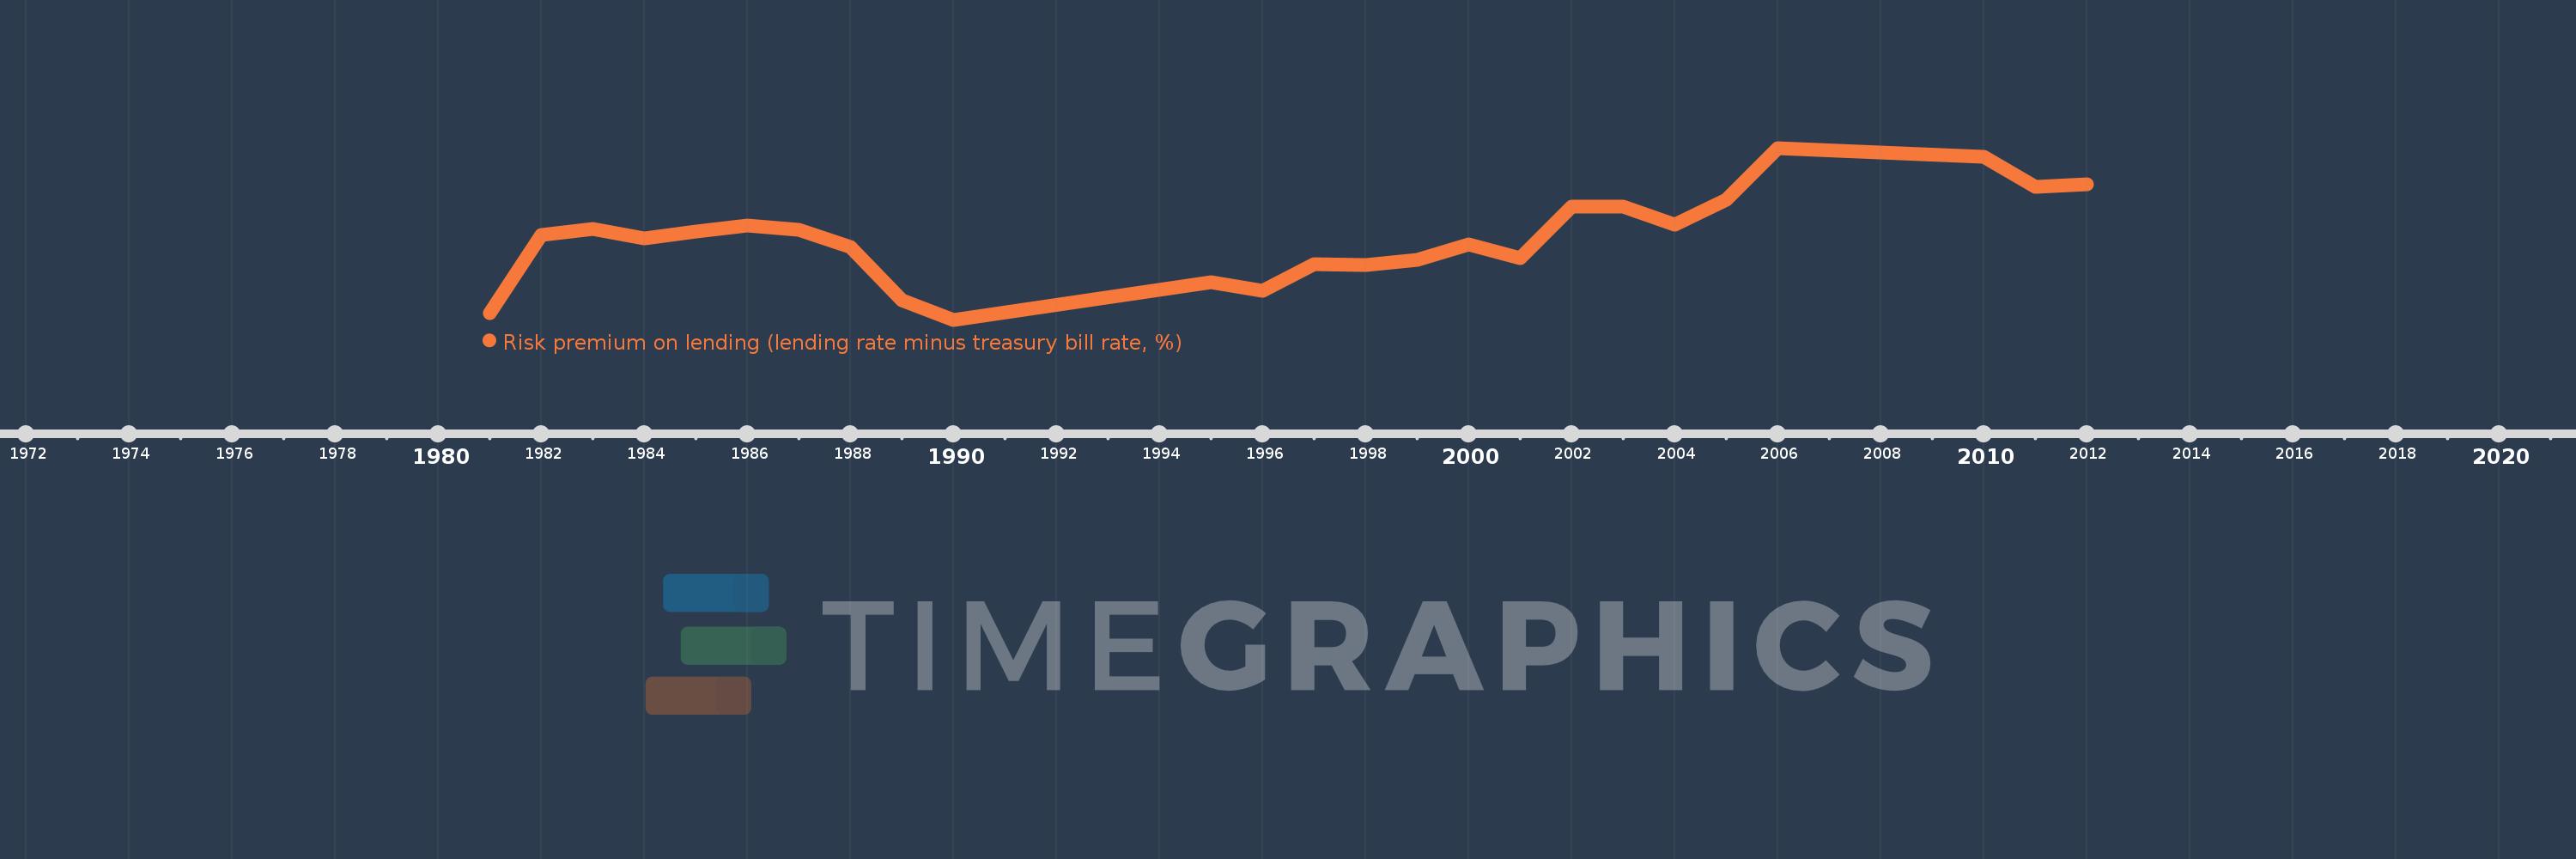
Risk premium on lending (lending rate minus treasury bill rate, %)
2012,2011,2010,2006,2005,2004,2003,2002,2001,2000,1999,1998,1997,1996,1995,1990,1989,1988,1987,1986,1985,1984,1983,1982,1981