33
/
AIzaSyB4mHJ5NPEv-XzF7P6NDYXjlkCWaeKw5bc
November 30, 2025
94091
Bulgaria
BGR
true
2
1
PPG, IBRD (AMT, current US$)
2016,2015,2014,2013,2012,2011,2010,2009,2008,2007,2006,2005,2004,2003,2002,2001,2000,1999,1998,1997
Create a timeline
Public Timelines
For education
For educational institutions
For teachers
For students
Cabinet
For educational institutions
For teachers
For students
Open cabinet
FAQ
Close
Create a timeline
Public timelines
FAQ
About & Feedback
Terms
Privacy
FAQ
Support 24/7
Cabinet
Get premium
Donate
Download
Global statistics library
→
Bulgaria
→
PPG, IBRD (AMT, current US$)
This statistics in other country:
Albania
Algeria
Angola
Argentina
Armenia
Azerbaijan
Bangladesh
Belarus
Belize
Bolivia
Bosnia and Herzegovina
Botswana
Brazil
Bulgaria
Burundi
Cabo Verde
Cameroon
Chad
China
Colombia
Congo, Dem. Rep.
Congo, Rep.
Costa Rica
Cote d'Ivoire
Dominica
Dominican Republic
East Asia & Pacific (excluding high income)
Ecuador
Egypt, Arab Rep.
El Salvador
Ethiopia
Europe & Central Asia (excluding high income)
Fiji
Gabon
Georgia
Ghana
Grenada
Guatemala
Guinea
Guyana
Honduras
IDA only
India
Indonesia
Iran, Islamic Rep.
Jamaica
Jordan
Kazakhstan
Kenya
Kosovo
Latin America & Caribbean (excluding high income)
Lebanon
Lesotho
Liberia
Low & middle income
Low income
Lower middle income
Macedonia, FYR
Madagascar
Malawi
Malaysia
Mauritania
Mauritius
Mexico
Middle East & North Africa (excluding high income)
Middle income
Moldova
Montenegro
Morocco
Myanmar
Nicaragua
Nigeria
Pakistan
Panama
Papua New Guinea
Paraguay
Peru
Philippines
Romania
Russian Federation
Senegal
Serbia
Sierra Leone
South Africa
South Asia
Sri Lanka
St. Lucia
St. Vincent and the Grenadines
Sub-Saharan Africa (excluding high income)
Sudan
Swaziland
Syrian Arab Republic
Tanzania
Thailand
Togo
Tunisia
Turkey
Turkmenistan
Uganda
Ukraine
Upper middle income
Uzbekistan
Venezuela, RB
Vietnam
Zambia
Zimbabwe
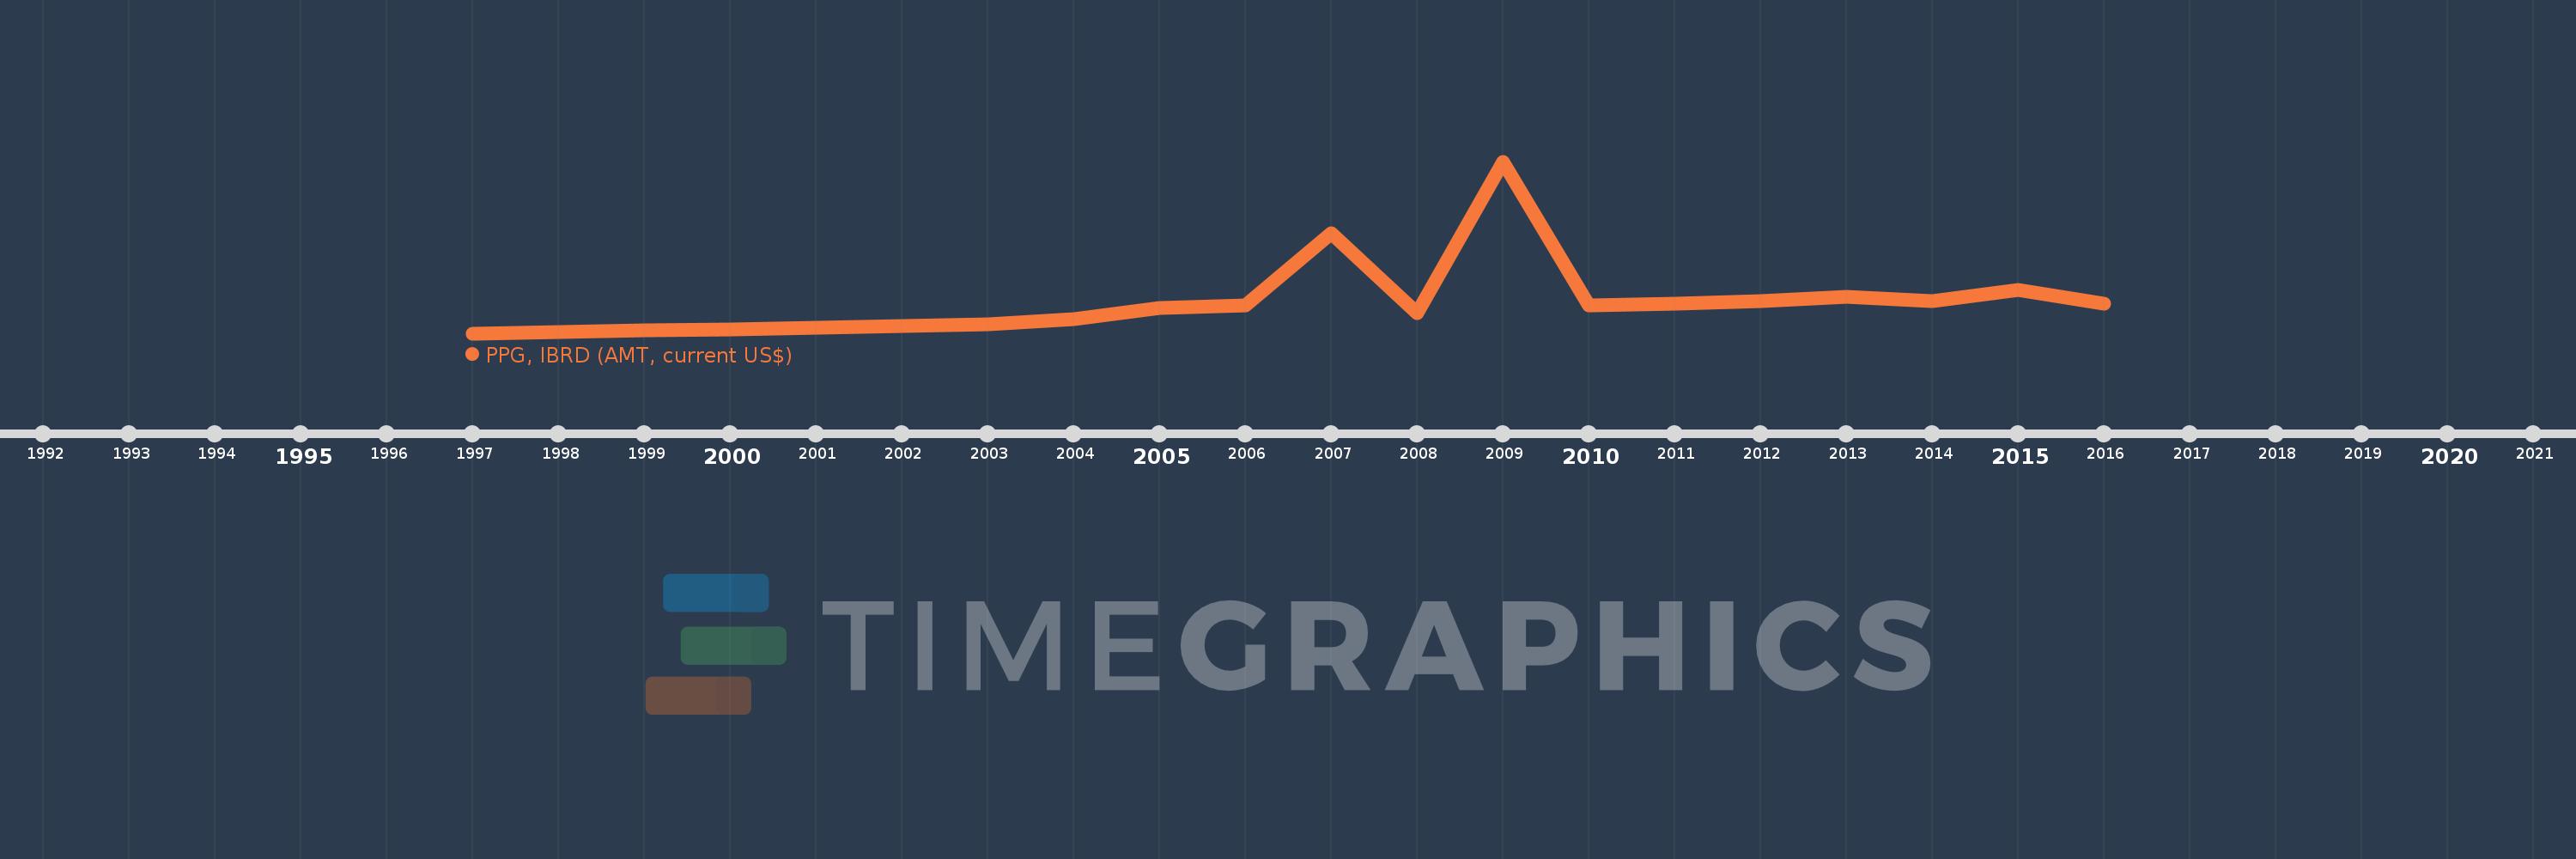
Timeline:
This timeline shows a graph from
1997
to
2016
of Bulgaria. No data until
1996
. Number of actual observations by date:
20
.
Source name:
World Development Indicators
Source organization:
World Bank, International Debt Statistics.
Categories, topics:
External Debt
Last updated:
apr 23, 2017
Indicators value changes by year
Meaning:
94.005 mln
Minimum:
12.604 mln
jan 1, 1997
Maximum:
462.418 mln
jan 1, 2009
At the date of observation
Value
Absolute change
Change from the previous value
jan 1, 1997
12.604 mln
+12.604 mln
0.0%
jan 1, 1998
16.074 mln
+3.47 mln
27.53%
jan 1, 1999
20.182 mln
+4.108 mln
25.56%
jan 1, 2000
22.024 mln
+1.842 mln
9.13%
jan 1, 2001
26.754 mln
+4.73 mln
21.48%
jan 1, 2002
32.311 mln
+5.557 mln
20.77%
jan 1, 2003
36.628 mln
+4.317 mln
13.36%
jan 1, 2004
50.186 mln
+13.558 mln
37.02%
jan 1, 2005
79.872 mln
+29.686 mln
59.15%
jan 1, 2006
85.084 mln
+5.212 mln
6.53%
jan 1, 2007
275.601 mln
+190.517 mln
223.92%
jan 1, 2008
64.676 mln
-210.925 mln
-76.53%
jan 1, 2009
462.418 mln
+397.742 mln
614.98%
jan 1, 2010
84.704 mln
-377.714 mln
-81.68%
jan 1, 2011
90.34 mln
+5.636 mln
6.65%
jan 1, 2012
97.699 mln
+7.359 mln
8.15%
jan 1, 2013
109.205 mln
+11.506 mln
11.78%
jan 1, 2014
96.442 mln
-12.763 mln
-11.69%
jan 1, 2015
126.597 mln
+30.155 mln
31.27%
jan 1, 2016
90.693 mln
-35.904 mln
-28.36%
Ranking of countries by current statistics by years
About & Feedback
Terms
Privacy
FAQ
Support 24/7
Cabinet
Get premium
Donate
The service accepts bank transfer (ACH, Wire) or cards (Visa, MasterCard, etc). Processed by Stripe.
Secured with SSL