33
/
AIzaSyB4mHJ5NPEv-XzF7P6NDYXjlkCWaeKw5bc
November 30, 2025
258817
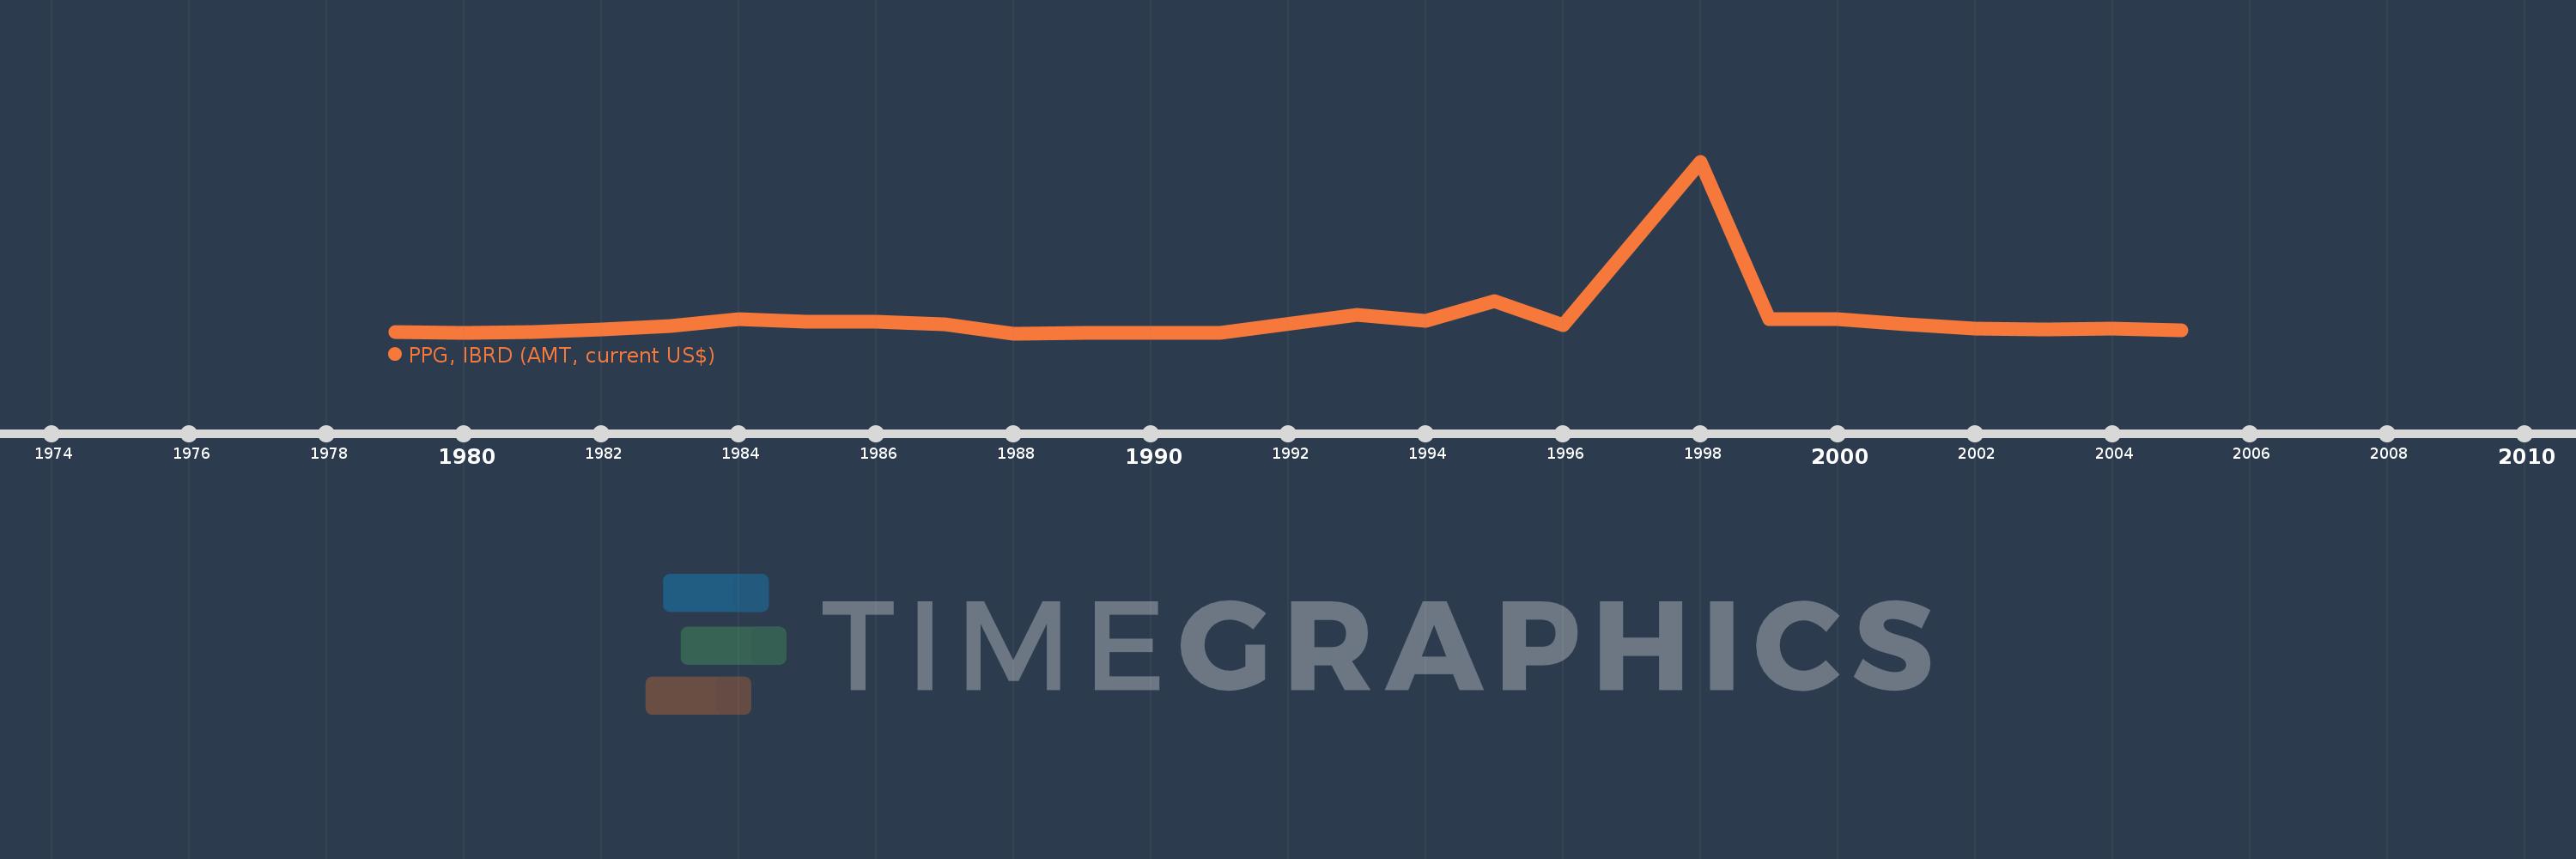
Syrian Arab Republic
SYR
true
2
1
PPG, IBRD (AMT, current US$)
2005,2004,2003,2002,2001,2000,1999,1998,1996,1995,1994,1993,1991,1989,1988,1987,1986,1985,1984,1983,1982,1981,1980,1979