Download This statistics in other country:
Timeline:
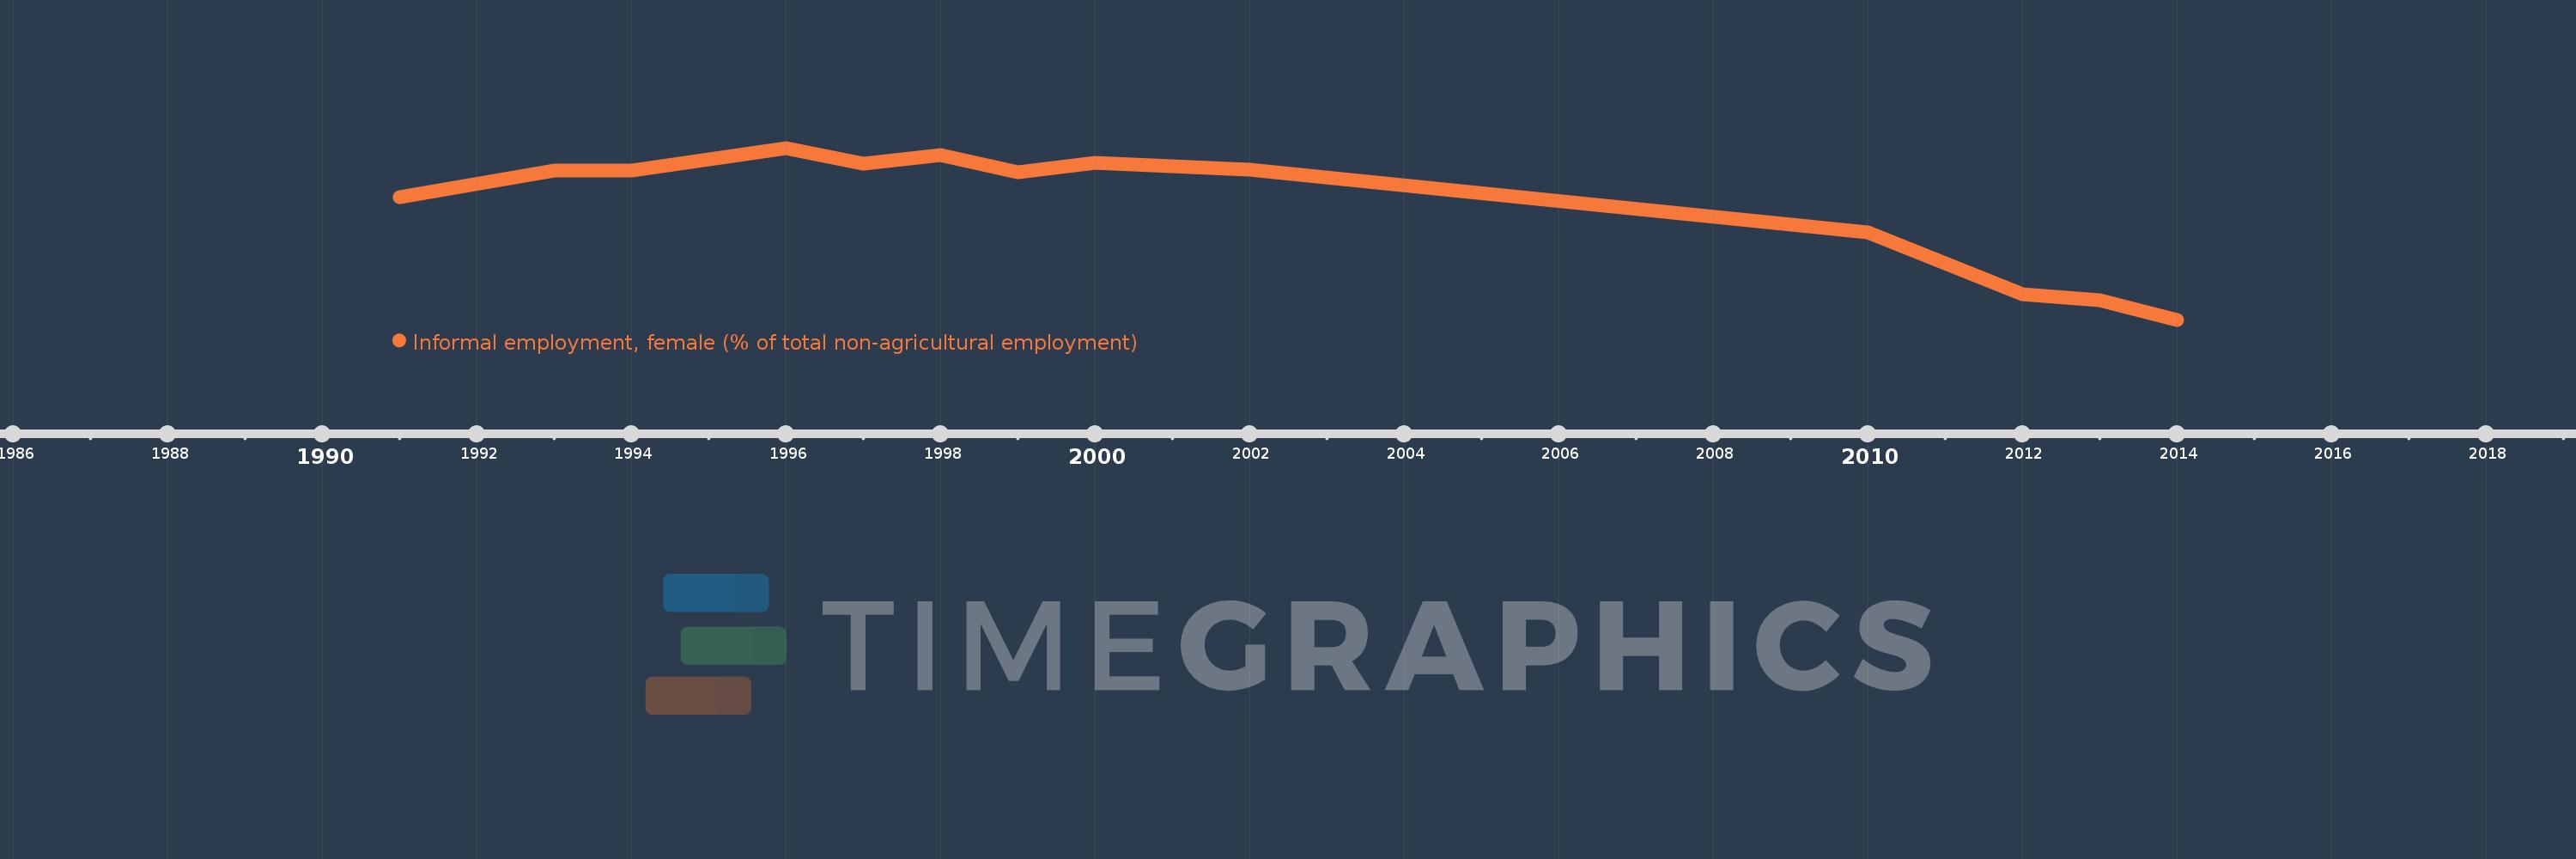
This timeline shows a graph from 1991 to 2014 of Brazil. No data until 1990. Number of actual observations by date: 13.
Source name:
World Development Indicators
Source organization:
International Labour Organization, Key Indicators of the Labour Market database.
Categories, topics:
Social Protection & Labor
Last updated:
apr 23, 2017
Indicators value changes by year
At the date of observation
Value
Absolute change
Change from the previous value
jan 1, 1991
49.0
+49.0
0.0%
jan 1, 1993
51.4
+2.4
4.9%
jan 1, 1996
53.4
+2.0
3.89%
jan 1, 1997
52.0
-1.4
-2.62%
jan 1, 1998
52.8
+0.8
1.54%
jan 1, 1999
51.2
-1.6
-3.03%
jan 1, 2000
52.1
+0.9
1.76%
jan 1, 2002
51.5
-0.6
-1.15%
jan 1, 2010
45.9
-5.6
-10.87%
jan 1, 2012
40.4
-5.5
-11.98%
jan 1, 2013
39.8
-0.6
-1.49%
jan 1, 2014
38.1
-1.7
-4.27%
Ranking of countries by current statistics by years