Download This statistics in other country:
Timeline:
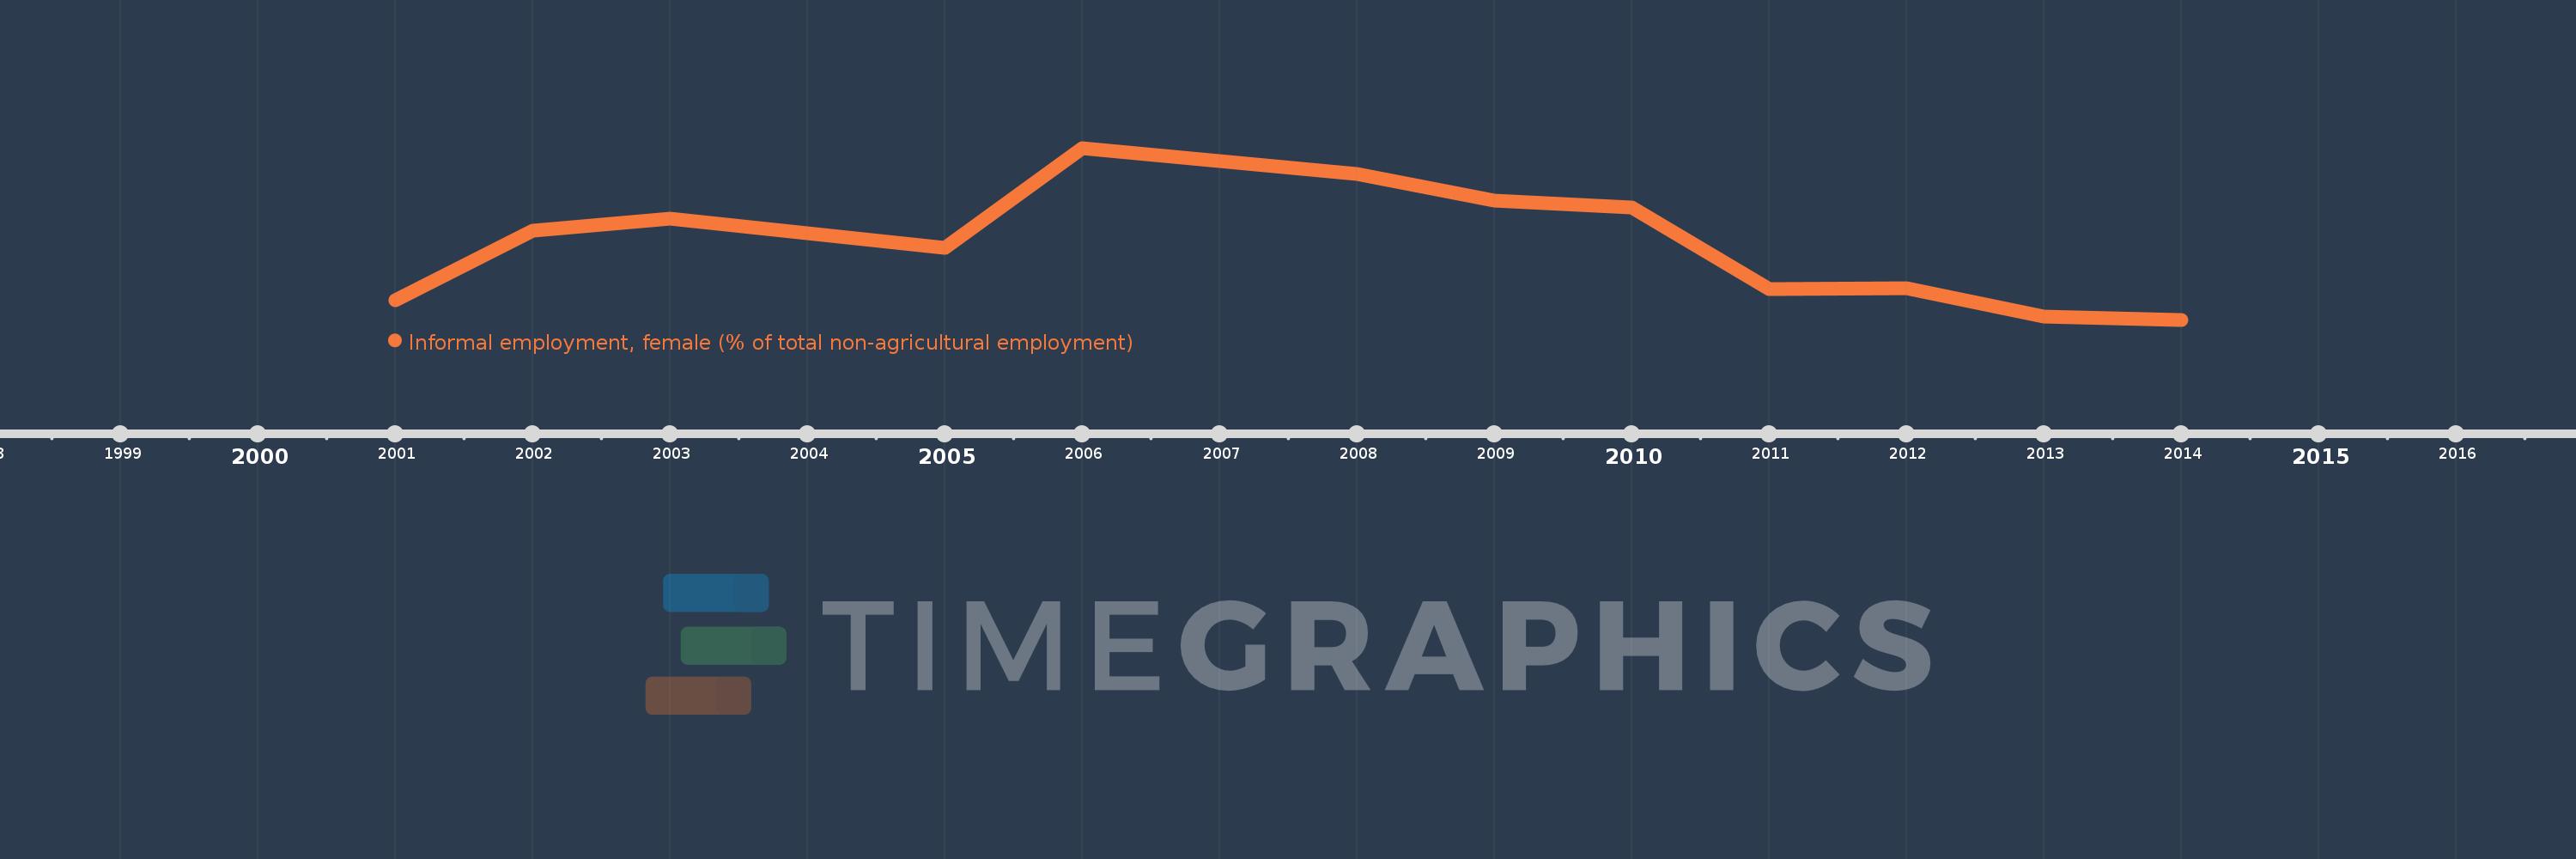
This timeline shows a graph from 2001 to 2014 of Costa Rica. No data until 2000. Number of actual observations by date: 13.
Source name:
World Development Indicators
Source organization:
International Labour Organization, Key Indicators of the Labour Market database.
Categories, topics:
Social Protection & Labor
Last updated:
apr 23, 2017
Indicators value changes by year
At the date of observation
Value
Absolute change
Change from the previous value
jan 1, 2001
37.7
+37.7
0.0%
jan 1, 2002
43.9
+6.2
16.45%
jan 1, 2003
45.0
+1.1
2.51%
jan 1, 2004
43.7
-1.3
-2.89%
jan 1, 2005
42.4
-1.3
-2.97%
jan 1, 2006
51.3
+8.9
20.99%
jan 1, 2008
49.0
-2.3
-4.48%
jan 1, 2009
46.6
-2.4
-4.9%
jan 1, 2010
46.0
-0.6
-1.29%
jan 1, 2011
38.7
-7.3
-15.87%
jan 1, 2012
38.8
+0.1
0.26%
jan 1, 2013
36.3
-2.5
-6.44%
jan 1, 2014
36.0
-0.3
-0.83%
Ranking of countries by current statistics by years