33
/
AIzaSyB4mHJ5NPEv-XzF7P6NDYXjlkCWaeKw5bc
November 30, 2025
87714
Bolivia
BOL
true
2
1
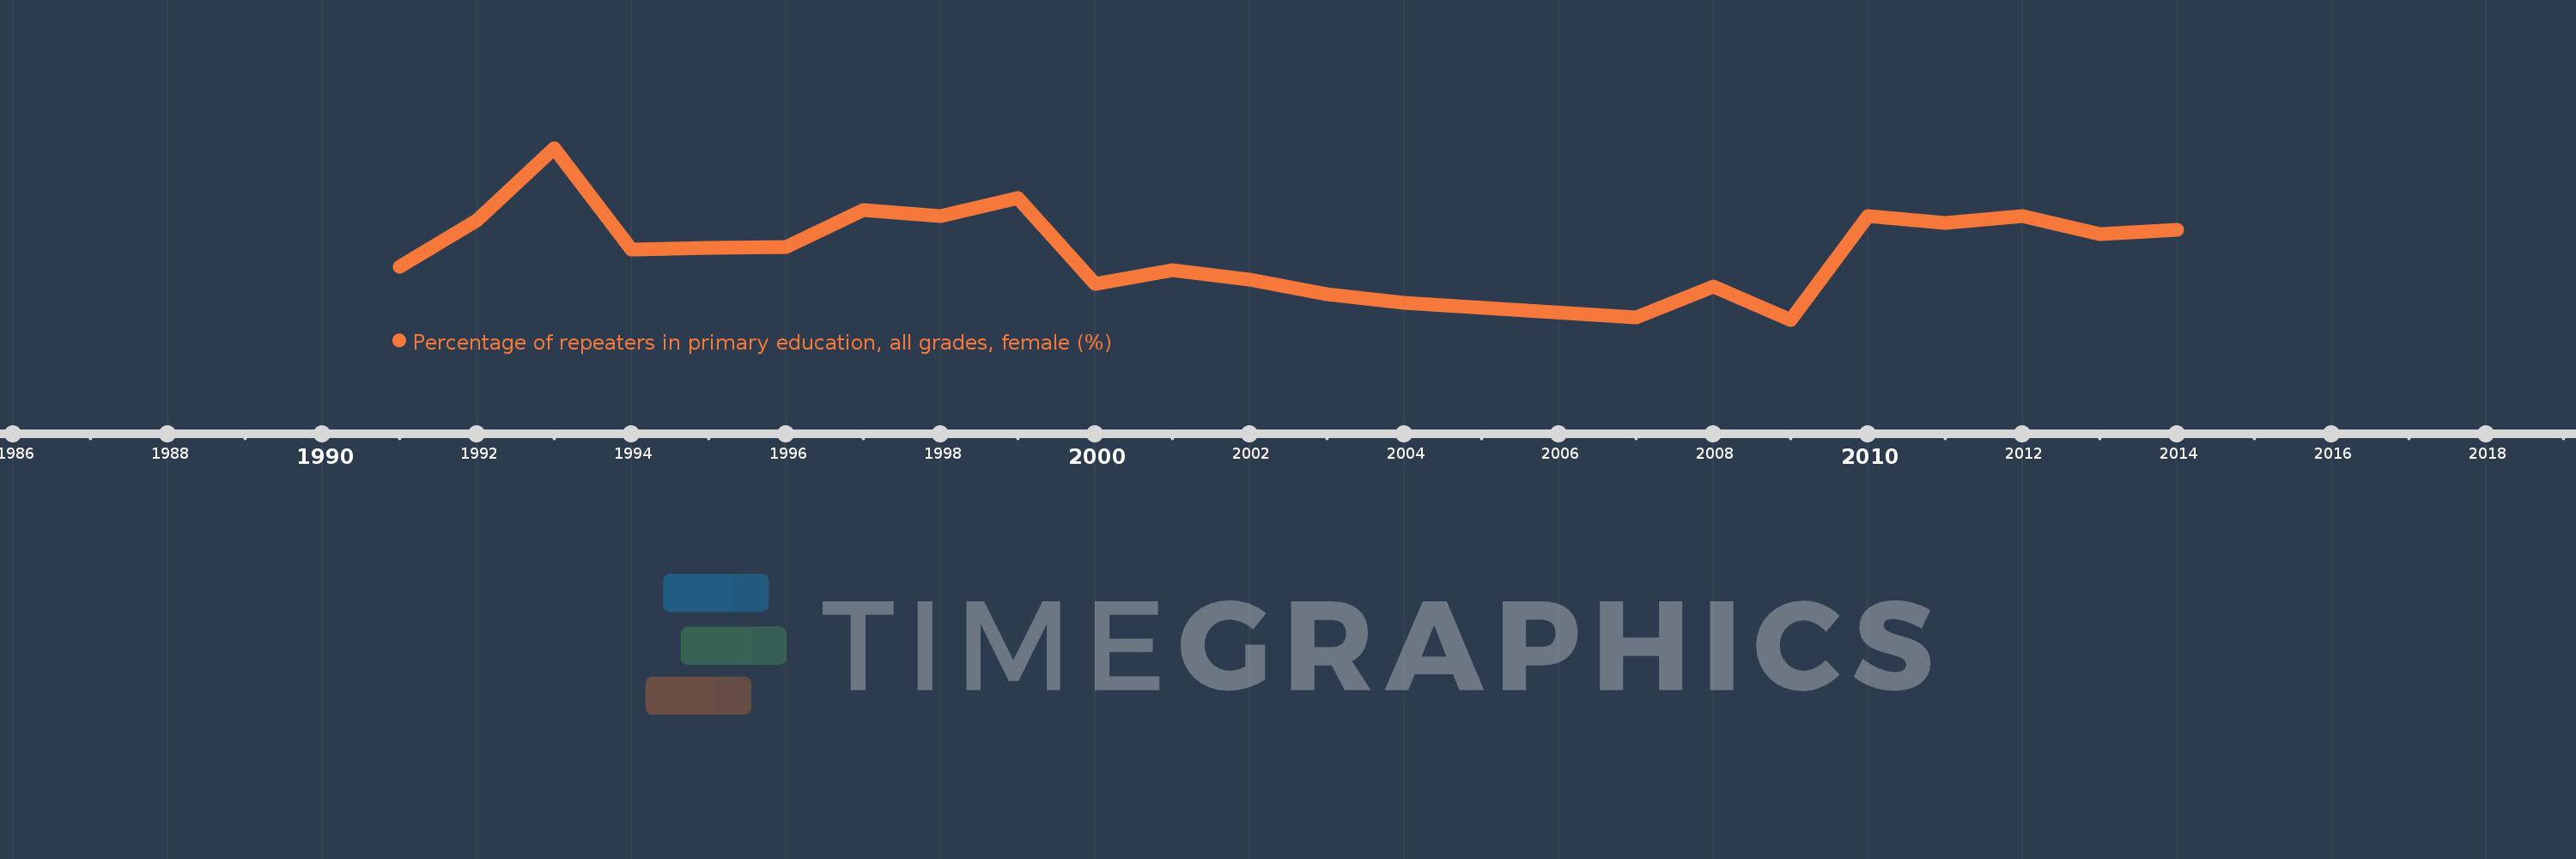
Percentage of repeaters in primary education, all grades, female (%)
2014,2013,2012,2011,2010,2009,2008,2007,2004,2003,2002,2001,2000,1999,1998,1997,1996,1995,1994,1993,1992,1991