33
/
AIzaSyB4mHJ5NPEv-XzF7P6NDYXjlkCWaeKw5bc
November 30, 2025
158821
Iraq
IRQ
true
2
1
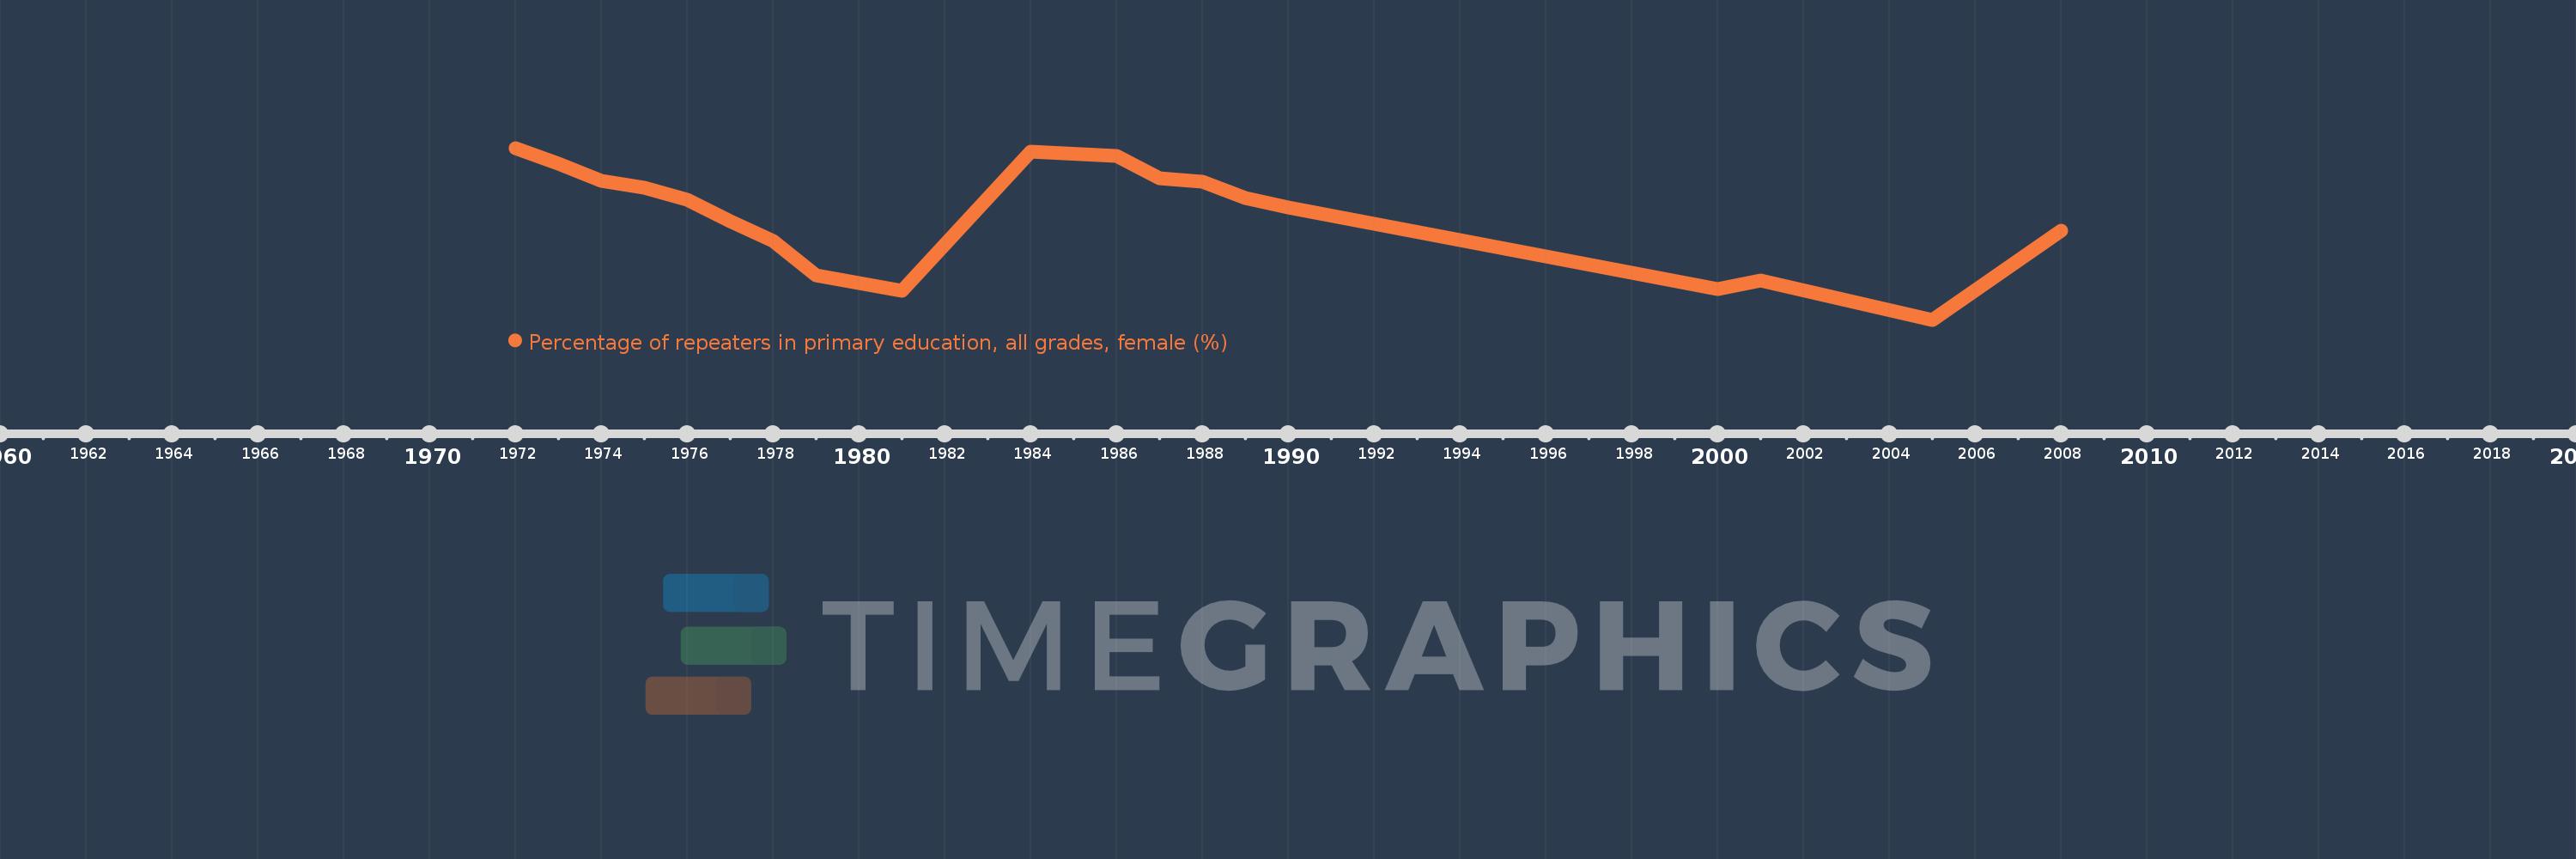
Percentage of repeaters in primary education, all grades, female (%)
2008,2005,2001,2000,1994,1990,1989,1988,1987,1986,1984,1981,1979,1978,1977,1976,1975,1974,1973,1972