33
/
AIzaSyB4mHJ5NPEv-XzF7P6NDYXjlkCWaeKw5bc
November 30, 2025
78858
Bangladesh
BGD
true
2
1
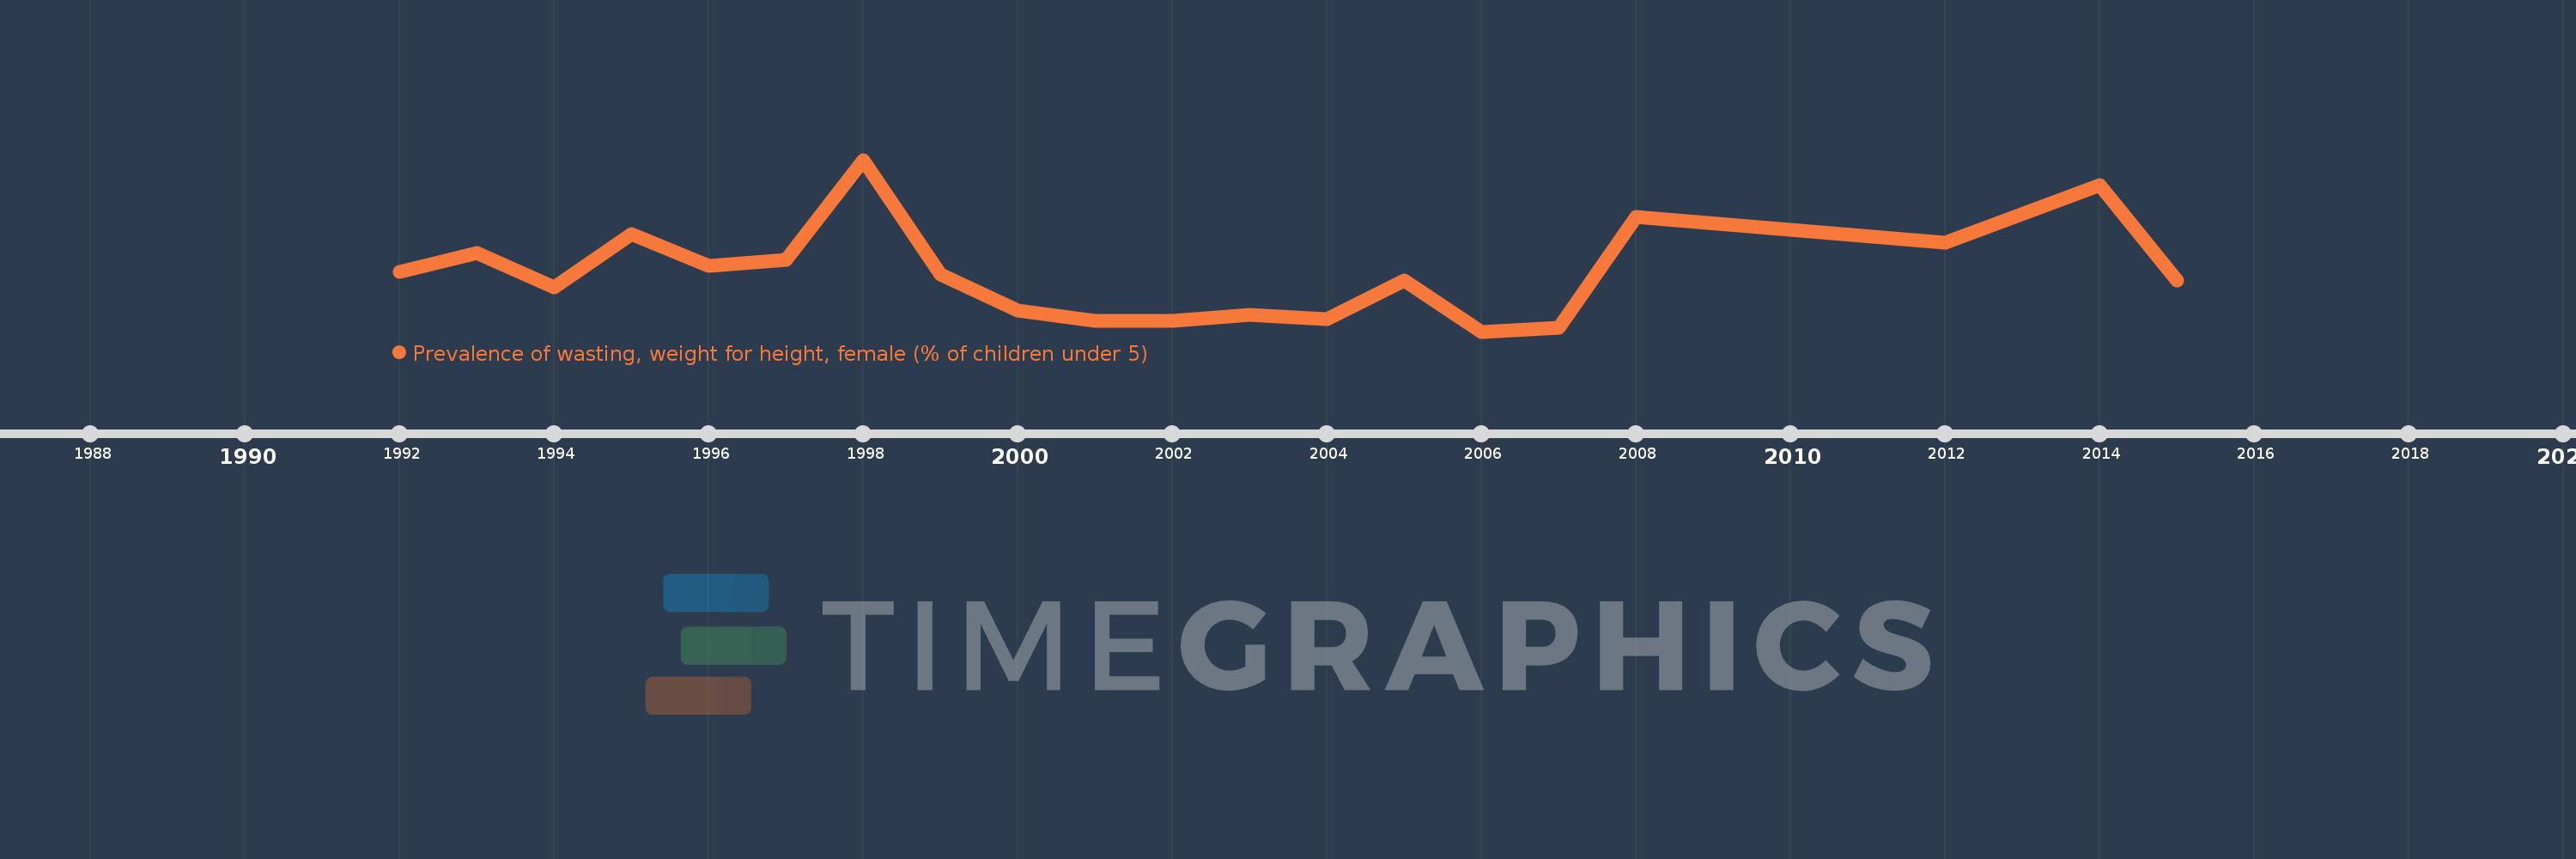
Prevalence of wasting, weight for height, female (% of children under 5)
2015,2014,2012,2008,2007,2006,2005,2004,2003,2002,2001,2000,1999,1998,1997,1996,1995,1994,1993,1992