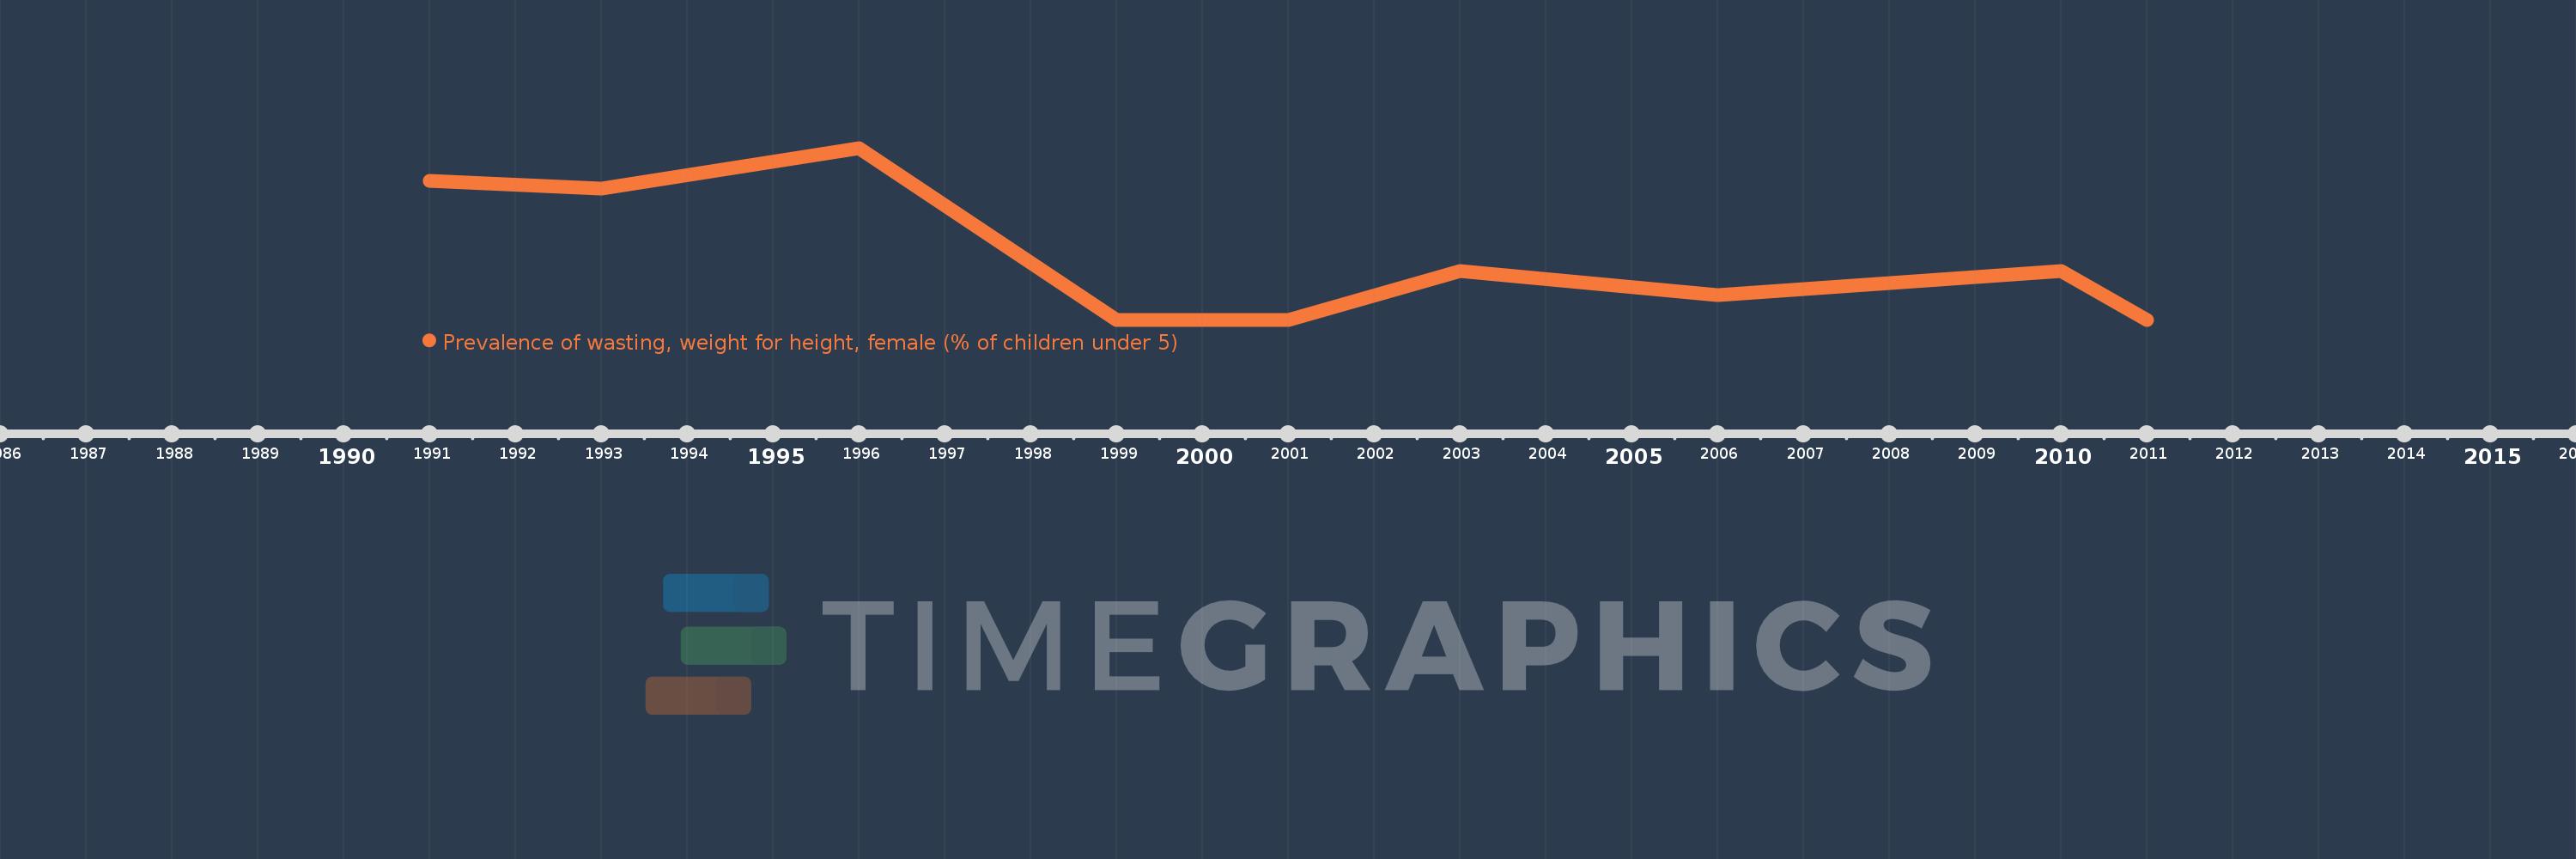
This timeline shows a graph from 1991 to 2011 of China. No data until 1990. Number of actual observations by date: 9.
Source name:
World Development Indicators
Source organization:
World Health Organization, Global Database on Child Growth and Malnutrition. Country-level data are unadjusted data from national surveys, and thus may not be comparable across countries.
Categories, topics:
Health
Last updated:
apr 23, 2017
Indicators value changes by year
Meaning:
2.867
Minimum:
2.1
jan 1, 1999
Maximum:
4.2
jan 1, 1996
At the date of observation
Value
Absolute change
Change from the previous value
jan 1, 1991
3.8
+3.8
0.0%
jan 1, 1993
3.7
-0.1
-2.63%
jan 1, 1996
4.2
+0.5
13.51%
jan 1, 1999
2.1
-2.1
-50.0%
jan 1, 2001
2.1
0.0
0.0%
jan 1, 2003
2.7
+0.6
28.57%
jan 1, 2006
2.4
-0.3
-11.11%
jan 1, 2010
2.7
+0.3
12.5%
jan 1, 2011
2.1
-0.6
-22.22%
Ranking of countries by current statistics by years