33
/
AIzaSyB4mHJ5NPEv-XzF7P6NDYXjlkCWaeKw5bc
November 30, 2025
72848
Australia
AUS
true
2
1
Educational attainment, at least completed lower secondary, population 25+, male (%) (cumulative)
2015,2014,2013,2012,2011,2010,2009,2008,2007,2006,2005
Create a timeline
Public Timelines
For education
For educational institutions
For teachers
For students
Cabinet
For educational institutions
For teachers
For students
Open cabinet
FAQ
Close
Create a timeline
Public timelines
FAQ
About & Feedback
Terms
Privacy
FAQ
Support 24/7
Cabinet
Get premium
Donate
Download
Global statistics library
→
Australia
→
Educational attainment, at least completed lower secondary, population 25+, male (%) (cumulative)
This statistics in other country:
Albania
Algeria
Andorra
Argentina
Armenia
Aruba
Australia
Austria
Azerbaijan
Bahamas, The
Bahrain
Bangladesh
Barbados
Belarus
Belgium
Belize
Benin
Bermuda
Bhutan
Bolivia
Bosnia and Herzegovina
Brazil
Bulgaria
Burkina Faso
Cambodia
Cameroon
Cayman Islands
Chad
Chile
China
Colombia
Congo, Dem. Rep.
Costa Rica
Croatia
Cuba
Cyprus
Czech Republic
Denmark
Dominica
Dominican Republic
Ecuador
El Salvador
Estonia
Ethiopia
Fiji
France
Georgia
Germany
Ghana
Greece
Guatemala
Guyana
Honduras
Hong Kong SAR, China
Hungary
Iceland
Indonesia
Iran, Islamic Rep.
Ireland
Israel
Italy
Jamaica
Jordan
Kazakhstan
Kenya
Korea, Rep.
Kuwait
Kyrgyz Republic
Latvia
Lebanon
Lesotho
Lithuania
Luxembourg
Macao SAR, China
Macedonia, FYR
Malawi
Malaysia
Maldives
Mali
Malta
Marshall Islands
Mauritius
Mexico
Moldova
Mongolia
Montenegro
Mozambique
Namibia
Netherlands
New Zealand
Norway
Oman
Pakistan
Panama
Paraguay
Peru
Philippines
Poland
Portugal
Puerto Rico
Qatar
Romania
Russian Federation
Rwanda
Sao Tome and Principe
Saudi Arabia
Senegal
Serbia
Seychelles
Singapore
Slovak Republic
Slovenia
South Africa
South Sudan
Spain
Sri Lanka
St. Lucia
Suriname
Sweden
Switzerland
Syrian Arab Republic
Tajikistan
Tanzania
Thailand
Togo
Tonga
Trinidad and Tobago
Tunisia
Turkey
Turkmenistan
Uganda
Ukraine
United Arab Emirates
United Kingdom
United States
Uruguay
Uzbekistan
Venezuela, RB
Vietnam
West Bank and Gaza
Zambia
Zimbabwe
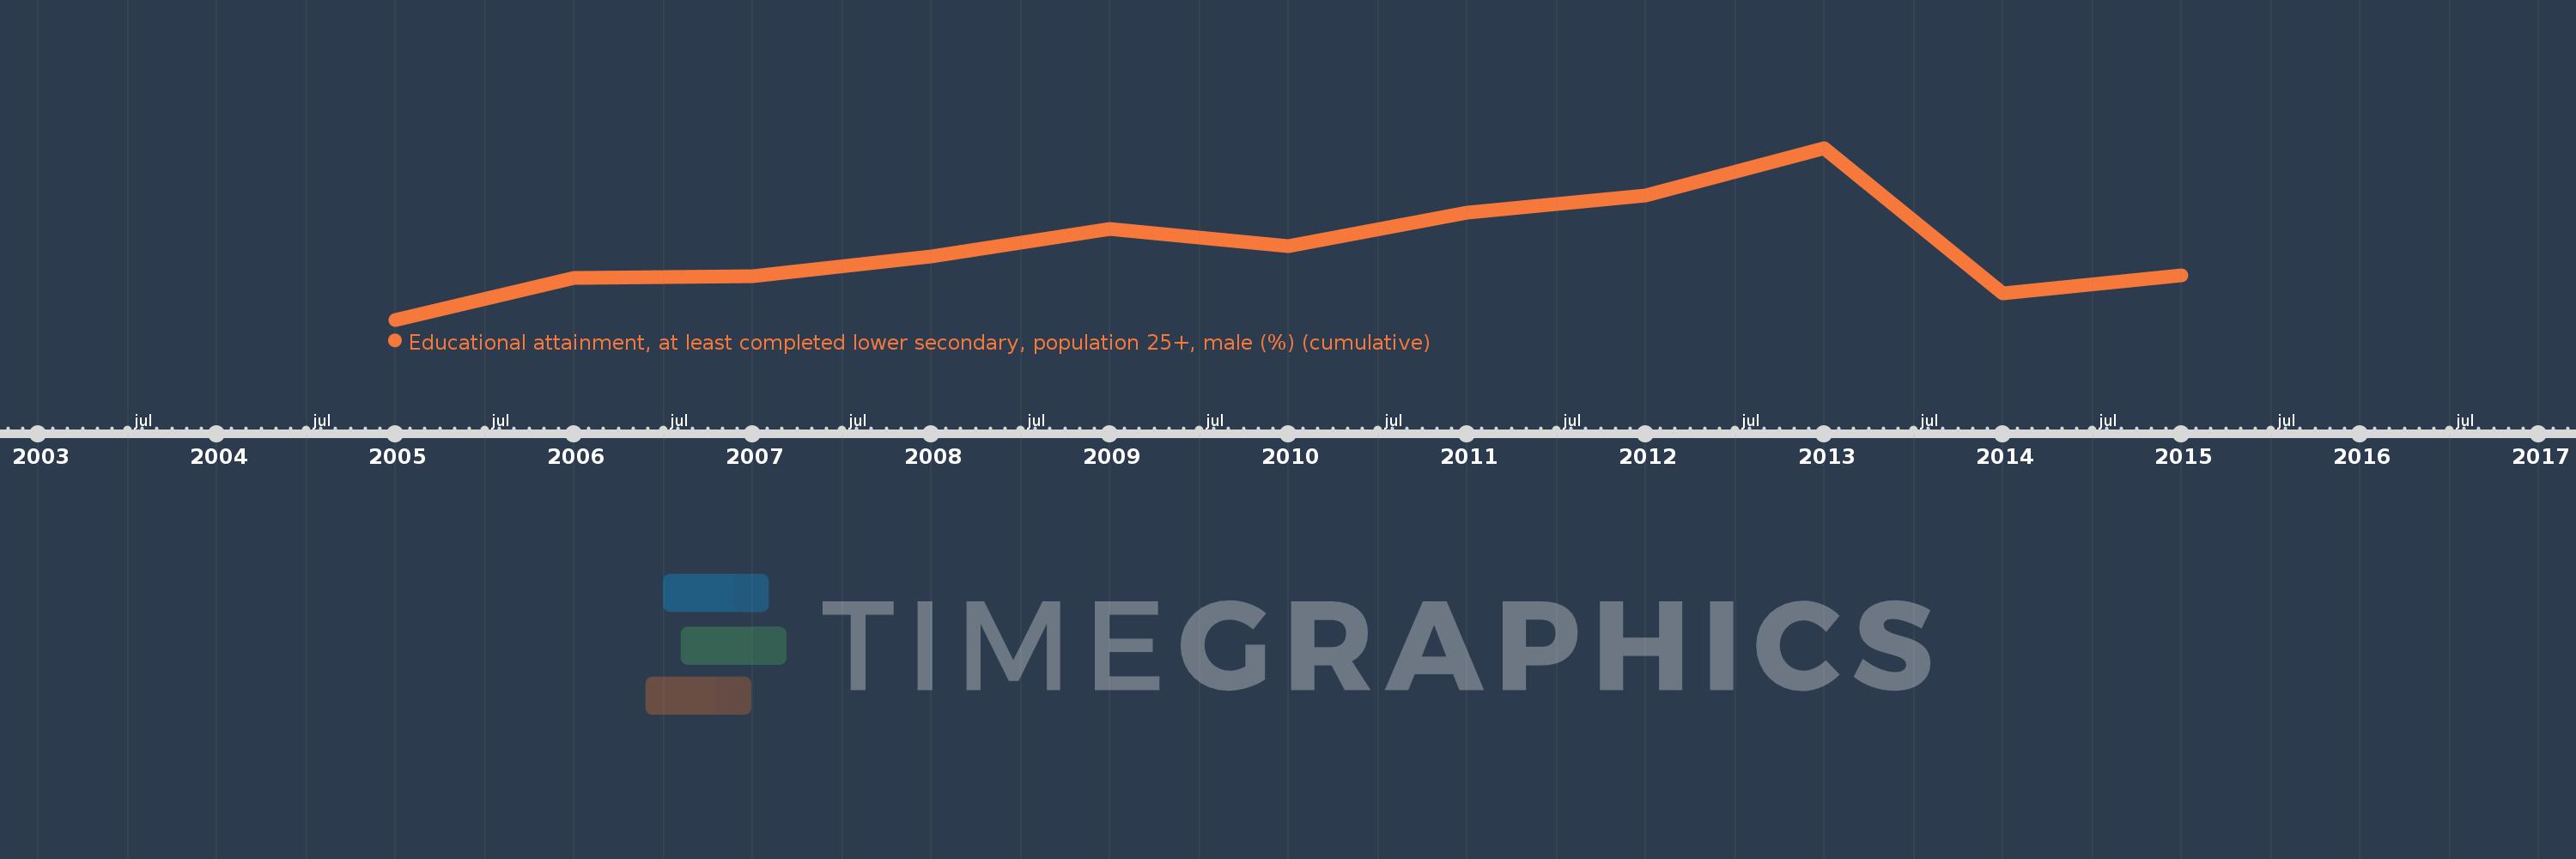
Timeline:
This timeline shows a graph from
2005
to
2015
of Australia. No data until
2004
. Number of actual observations by date:
11
.
Source name:
World Development Indicators
Source organization:
United Nations Educational, Scientific, and Cultural Organization (UNESCO) Institute for Statistics.
Categories, topics:
Education, Gender
Last updated:
apr 23, 2017
Indicators value changes by year
Meaning:
92.186
Minimum:
90.447
jan 1, 2005
Maximum:
94.622
jan 1, 2013
At the date of observation
Value
Absolute change
Change from the previous value
jan 1, 2005
90.447
+90.447
0.0%
jan 1, 2006
91.458
+1.011
1.12%
jan 1, 2007
91.512
+0.054
0.06%
jan 1, 2008
91.982
+0.469
0.51%
jan 1, 2009
92.653
+0.671
0.73%
jan 1, 2010
92.236
-0.417
-0.45%
jan 1, 2011
93.048
+0.812
0.88%
jan 1, 2012
93.472
+0.424
0.46%
jan 1, 2013
94.622
+1.15
1.23%
jan 1, 2014
91.085
-3.537
-3.74%
jan 1, 2015
91.532
+0.447
0.49%
Ranking of countries by current statistics by years
About & Feedback
Terms
Privacy
FAQ
Support 24/7
Cabinet
Get premium
Donate
The service accepts bank transfer (ACH, Wire) or cards (Visa, MasterCard, etc). Processed by Stripe.
Secured with SSL