33
/
AIzaSyB4mHJ5NPEv-XzF7P6NDYXjlkCWaeKw5bc
November 30, 2025
71705
Armenia
ARM
true
2
1
PPG, IDA (DOD, current US$)
2016,2015,2014,2013,2012,2011,2010,2009,2008,2007,2006,2005,2004,2003,2002,2001,2000,1999,1998,1997,1996,1995
Create a timeline
Public Timelines
For education
For educational institutions
For teachers
For students
Cabinet
For educational institutions
For teachers
For students
Open cabinet
FAQ
Close
Create a timeline
Public timelines
FAQ
About & Feedback
Terms
Privacy
FAQ
Support 24/7
Cabinet
Get premium
Donate
Download
Global statistics library
→
Armenia
→
PPG, IDA (DOD, current US$)
This statistics in other country:
Afghanistan
Albania
Angola
Armenia
Azerbaijan
Bangladesh
Benin
Bhutan
Bolivia
Bosnia and Herzegovina
Botswana
Burkina Faso
Burundi
Cabo Verde
Cambodia
Cameroon
Central African Republic
Chad
China
Colombia
Comoros
Congo, Dem. Rep.
Congo, Rep.
Costa Rica
Cote d'Ivoire
Djibouti
Dominica
Dominican Republic
East Asia & Pacific (excluding high income)
Ecuador
Egypt, Arab Rep.
El Salvador
Eritrea
Ethiopia
Europe & Central Asia (excluding high income)
Gambia, The
Georgia
Ghana
Grenada
Guinea
Guinea-Bissau
Guyana
Haiti
Honduras
IDA only
India
Indonesia
Jordan
Kenya
Kosovo
Kyrgyz Republic
Lao PDR
Latin America & Caribbean (excluding high income)
Lesotho
Liberia
Low & middle income
Low income
Lower middle income
Macedonia, FYR
Madagascar
Malawi
Maldives
Mali
Mauritania
Mauritius
Middle East & North Africa (excluding high income)
Middle income
Moldova
Mongolia
Montenegro
Morocco
Mozambique
Myanmar
Nepal
Nicaragua
Niger
Nigeria
Pakistan
Papua New Guinea
Paraguay
Philippines
Rwanda
Samoa
Sao Tome and Principe
Senegal
Serbia
Sierra Leone
Solomon Islands
Somalia
South Africa
South Asia
Sri Lanka
St. Lucia
St. Vincent and the Grenadines
Sub-Saharan Africa (excluding high income)
Sudan
Swaziland
Syrian Arab Republic
Tajikistan
Tanzania
Thailand
Togo
Tonga
Tunisia
Turkey
Uganda
Upper middle income
Uzbekistan
Vanuatu
Vietnam
Yemen, Rep.
Zambia
Zimbabwe
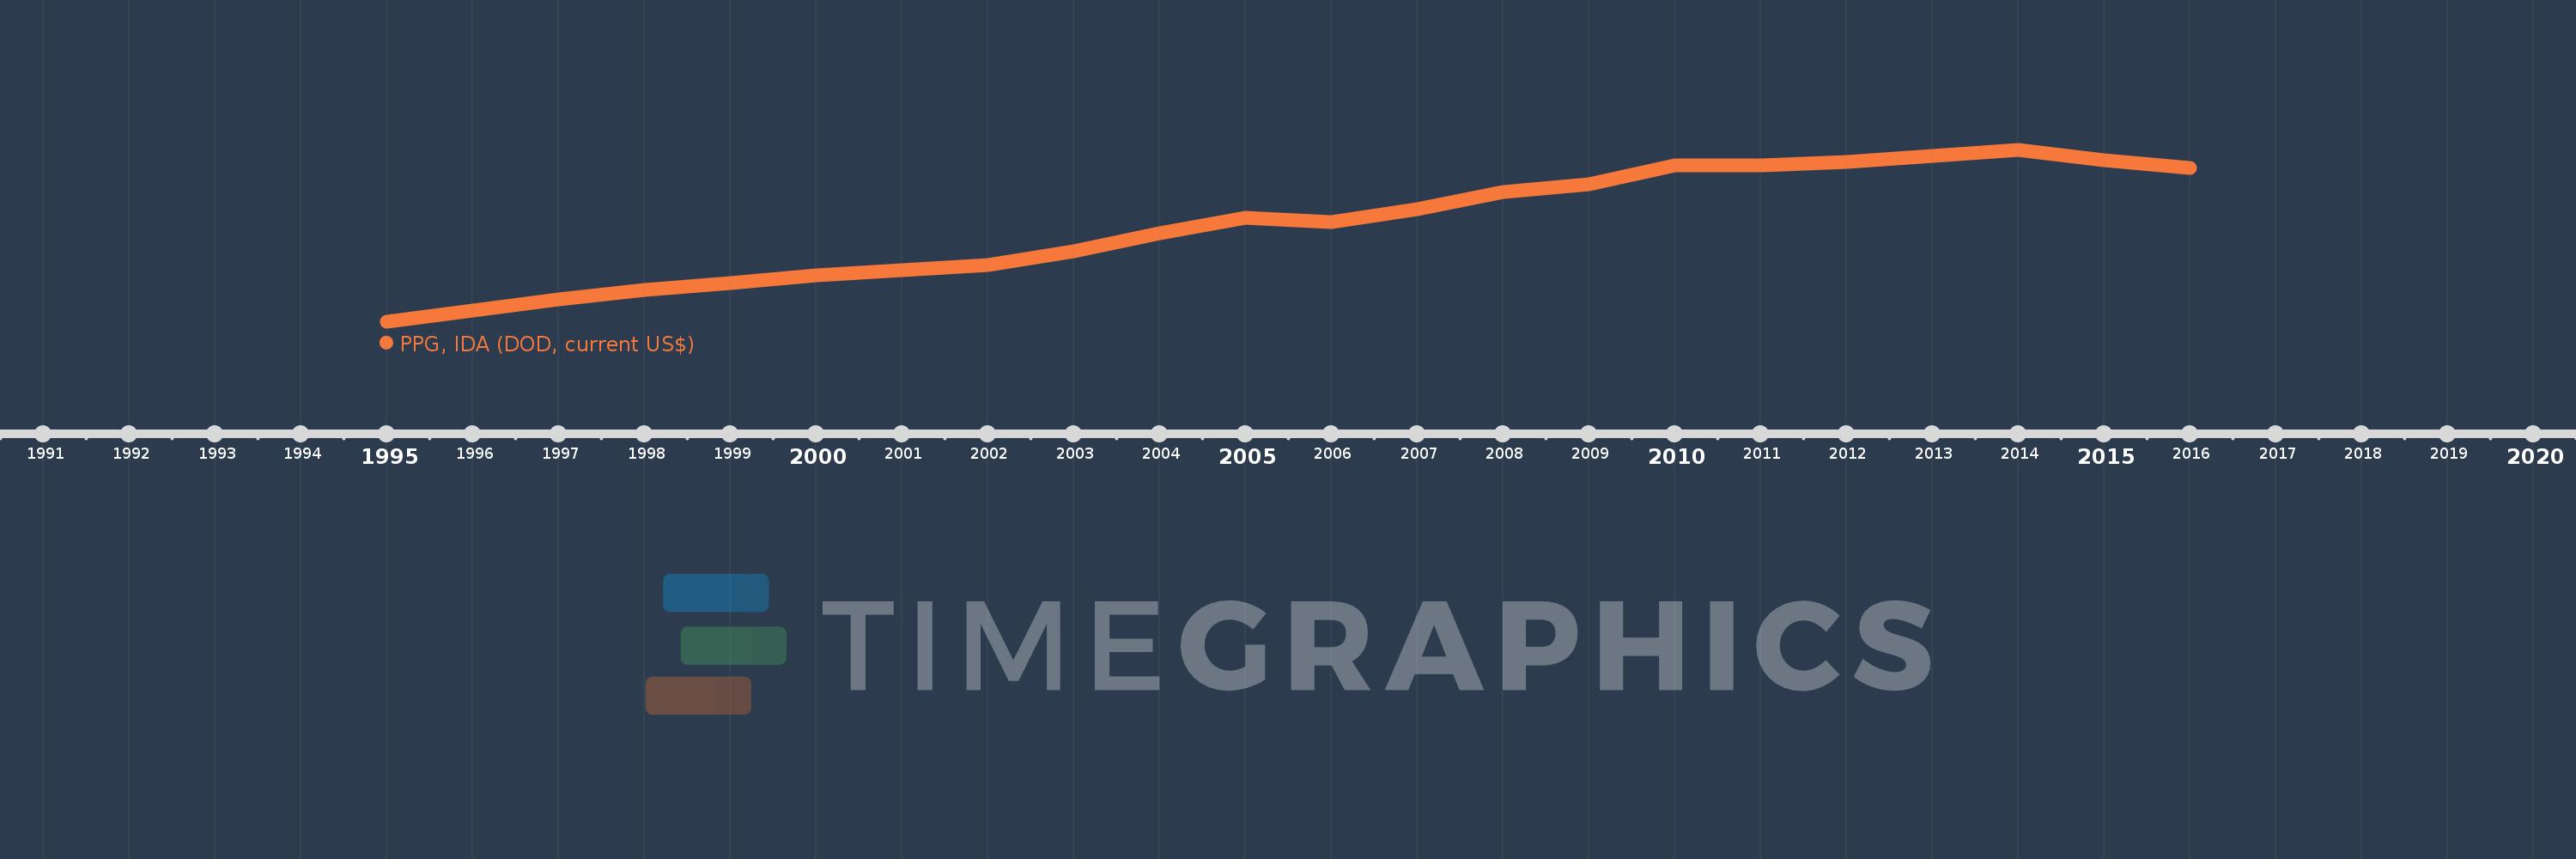
Timeline:
This timeline shows a graph from
1995
to
2016
of Armenia. No data until
1994
. Number of actual observations by date:
22
.
Source name:
World Development Indicators
Source organization:
World Bank, International Debt Statistics.
Categories, topics:
External Debt
Last updated:
apr 23, 2017
Indicators value changes by year
Meaning:
721.446 mln
Minimum:
5.563 mln
jan 1, 1995
Maximum:
1.275 bln
jan 1, 2014
At the date of observation
Value
Absolute change
Change from the previous value
jan 1, 1995
5.563 mln
+5.563 mln
0.0%
jan 1, 1996
90.938 mln
+85.375 mln
1.53K%
jan 1, 1997
174.048 mln
+83.11 mln
91.39%
jan 1, 1998
240.254 mln
+66.206 mln
38.04%
jan 1, 1999
292.84 mln
+52.586 mln
21.89%
jan 1, 2000
352.099 mln
+59.259 mln
20.24%
jan 1, 2001
388.291 mln
+36.192 mln
10.28%
jan 1, 2002
427.876 mln
+39.585 mln
10.19%
jan 1, 2003
529.94 mln
+102.064 mln
23.85%
jan 1, 2004
661.599 mln
+131.659 mln
24.84%
jan 1, 2005
772.576 mln
+110.977 mln
16.77%
jan 1, 2006
746.036 mln
-26.54 mln
-3.44%
jan 1, 2007
841.246 mln
+95.21 mln
12.76%
jan 1, 2008
964.653 mln
+123.407 mln
14.67%
jan 1, 2009
1.025 bln
+60.709 mln
6.29%
jan 1, 2010
1.161 bln
+135.467 mln
13.21%
jan 1, 2011
1.161 bln
-109.0K
-0.01%
jan 1, 2012
1.187 bln
+26.548 mln
2.29%
jan 1, 2013
1.235 bln
+48.188 mln
4.06%
jan 1, 2014
1.275 bln
+39.565 mln
3.2%
jan 1, 2015
1.199 bln
-76.479 mln
-6.0%
jan 1, 2016
1.141 bln
-57.894 mln
-4.83%
Ranking of countries by current statistics by years
About & Feedback
Terms
Privacy
FAQ
Support 24/7
Cabinet
Get premium
Donate
The service accepts bank transfer (ACH, Wire) or cards (Visa, MasterCard, etc). Processed by Stripe.
Secured with SSL