33
/
AIzaSyB4mHJ5NPEv-XzF7P6NDYXjlkCWaeKw5bc
November 1, 2025
184416
Macedonia, FYR
MKD
true
2
1
PPG, IDA (DOD, current US$)
2016,2015,2014,2013,2012,2011,2010,2009,2008,2007,2006,2005,2004,2003,2002,2001,2000,1999,1998,1997,1996,1995
Create a timeline
Public Timelines
For education
For educational institutions
For teachers
For students
Cabinet
For educational institutions
For teachers
For students
Open cabinet
FAQ
Get premium
Close
Create a timeline
Public timelines
FAQ
About & Feedback
Terms
Privacy
FAQ
Support 24/7
Cabinet
Get premium
Donate
Download
Global statistics library
→
Macedonia, FYR
→
PPG, IDA (DOD, current US$)
This statistics in other country:
Afghanistan
Albania
Angola
Armenia
Azerbaijan
Bangladesh
Benin
Bhutan
Bolivia
Bosnia and Herzegovina
Botswana
Burkina Faso
Burundi
Cabo Verde
Cambodia
Cameroon
Central African Republic
Chad
China
Colombia
Comoros
Congo, Dem. Rep.
Congo, Rep.
Costa Rica
Cote d'Ivoire
Djibouti
Dominica
Dominican Republic
East Asia & Pacific (excluding high income)
Ecuador
Egypt, Arab Rep.
El Salvador
Eritrea
Ethiopia
Europe & Central Asia (excluding high income)
Gambia, The
Georgia
Ghana
Grenada
Guinea
Guinea-Bissau
Guyana
Haiti
Honduras
IDA only
India
Indonesia
Jordan
Kenya
Kosovo
Kyrgyz Republic
Lao PDR
Latin America & Caribbean (excluding high income)
Lesotho
Liberia
Low & middle income
Low income
Lower middle income
Macedonia, FYR
Madagascar
Malawi
Maldives
Mali
Mauritania
Mauritius
Middle East & North Africa (excluding high income)
Middle income
Moldova
Mongolia
Montenegro
Morocco
Mozambique
Myanmar
Nepal
Nicaragua
Niger
Nigeria
Pakistan
Papua New Guinea
Paraguay
Philippines
Rwanda
Samoa
Sao Tome and Principe
Senegal
Serbia
Sierra Leone
Solomon Islands
Somalia
South Africa
South Asia
Sri Lanka
St. Lucia
St. Vincent and the Grenadines
Sub-Saharan Africa (excluding high income)
Sudan
Swaziland
Syrian Arab Republic
Tajikistan
Tanzania
Thailand
Togo
Tonga
Tunisia
Turkey
Uganda
Upper middle income
Uzbekistan
Vanuatu
Vietnam
Yemen, Rep.
Zambia
Zimbabwe
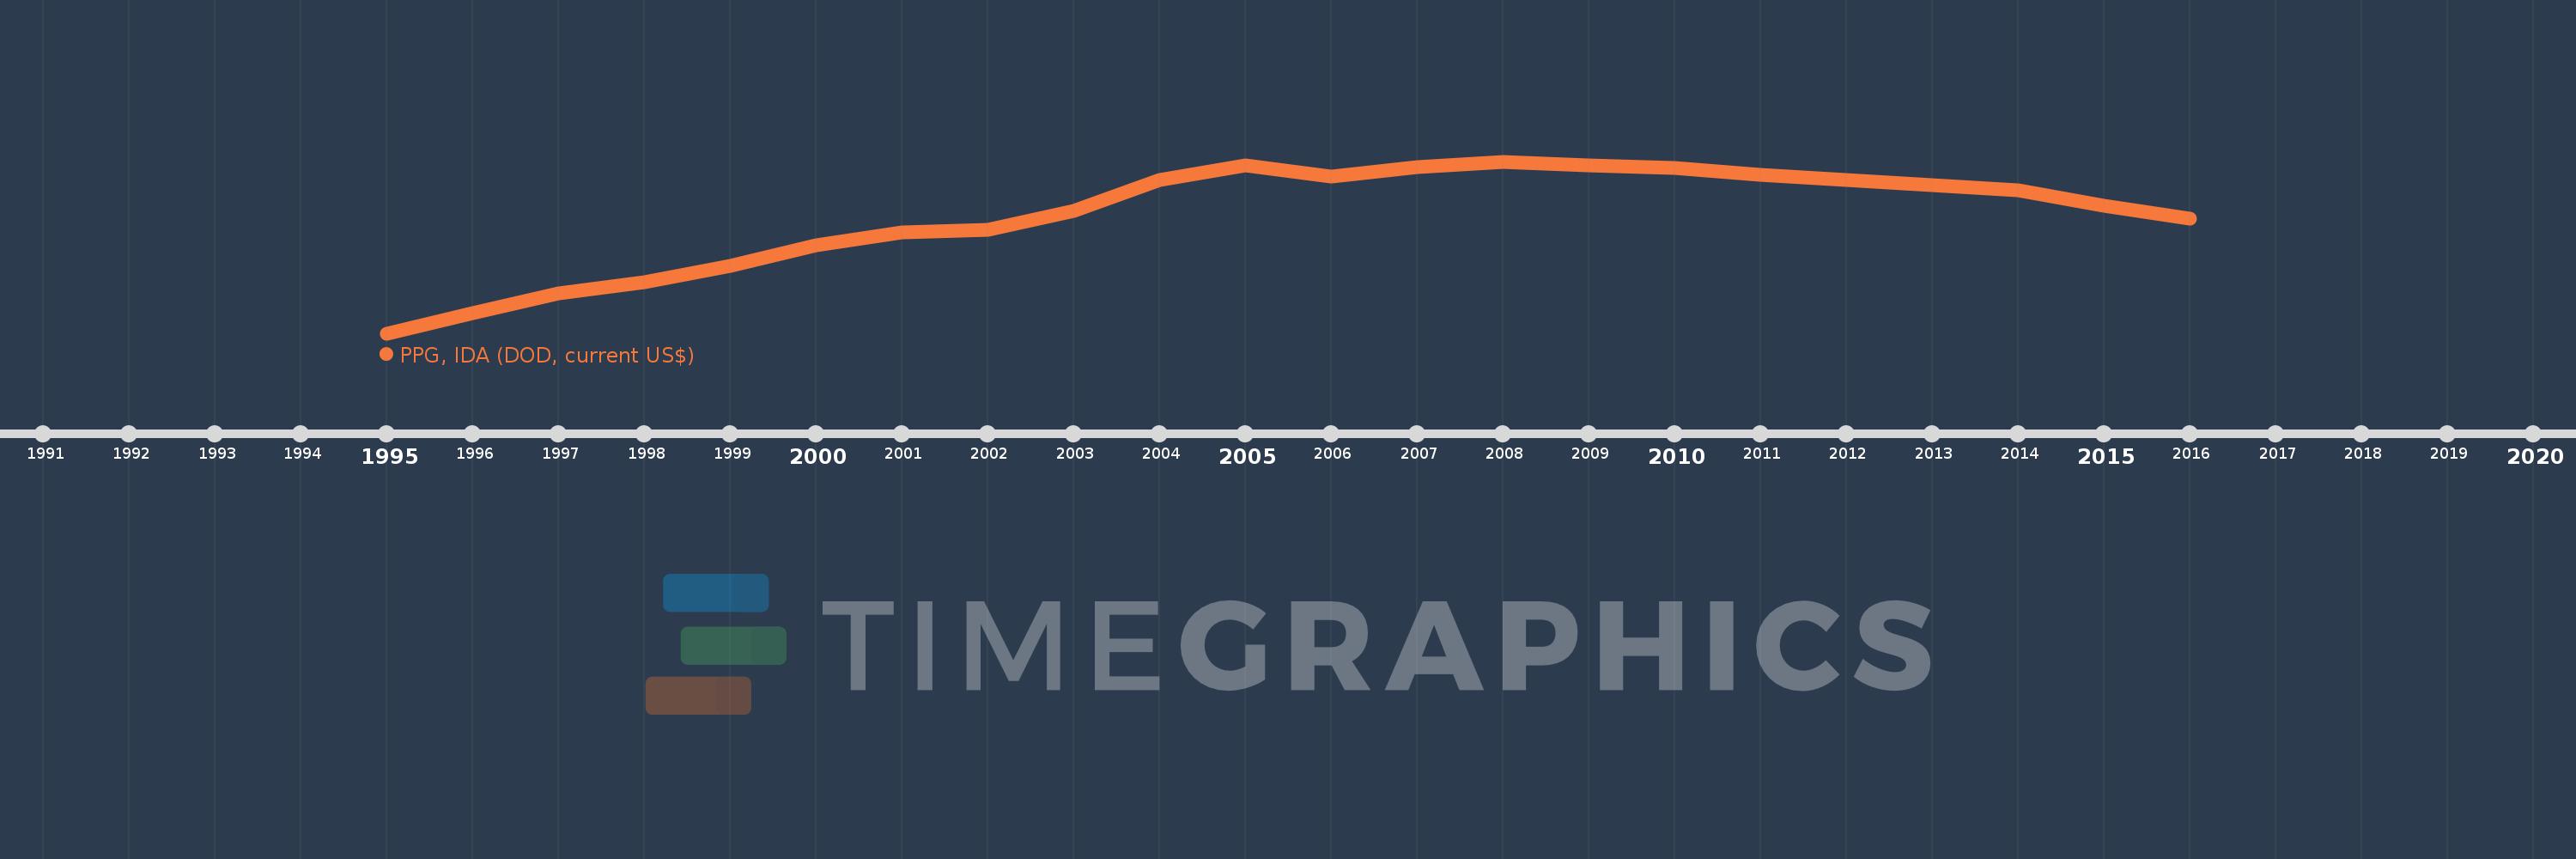
Timeline:
This timeline shows a graph from
1995
to
2016
of Macedonia, FYR. No data until
1994
. Number of actual observations by date:
22
.
Source name:
World Development Indicators
Source organization:
World Bank, International Debt Statistics.
Categories, topics:
External Debt
Last updated:
apr 23, 2017
Indicators value changes by year
Meaning:
283.275 mln
Minimum:
42.02 mln
jan 1, 1995
Maximum:
394.404 mln
jan 1, 2008
At the date of observation
Value
Absolute change
Change from the previous value
jan 1, 1995
42.02 mln
+42.02 mln
0.0%
jan 1, 1996
83.577 mln
+41.557 mln
98.9%
jan 1, 1997
124.635 mln
+41.058 mln
49.13%
jan 1, 1998
146.057 mln
+21.422 mln
17.19%
jan 1, 1999
180.983 mln
+34.926 mln
23.91%
jan 1, 2000
222.615 mln
+41.632 mln
23.0%
jan 1, 2001
249.111 mln
+26.496 mln
11.9%
jan 1, 2002
254.203 mln
+5.092 mln
2.04%
jan 1, 2003
293.44 mln
+39.237 mln
15.44%
jan 1, 2004
356.053 mln
+62.613 mln
21.34%
jan 1, 2005
386.692 mln
+30.639 mln
8.61%
jan 1, 2006
363.693 mln
-22.999 mln
-5.95%
jan 1, 2007
382.991 mln
+19.298 mln
5.31%
jan 1, 2008
394.404 mln
+11.413 mln
2.98%
jan 1, 2009
385.976 mln
-8.428 mln
-2.14%
jan 1, 2010
381.616 mln
-4.36 mln
-1.13%
jan 1, 2011
366.627 mln
-14.989 mln
-3.93%
jan 1, 2012
356.726 mln
-9.901 mln
-2.7%
jan 1, 2013
345.663 mln
-11.063 mln
-3.1%
jan 1, 2014
334.573 mln
-11.09 mln
-3.21%
jan 1, 2015
303.151 mln
-31.422 mln
-9.39%
jan 1, 2016
277.249 mln
-25.902 mln
-8.54%
Ranking of countries by current statistics by years
About & Feedback
Terms
Privacy
FAQ
Support 24/7
Cabinet
Get premium
Donate
The service accepts bank transfer (ACH, Wire) or cards (Visa, MasterCard, etc). Processed by Stripe.
Secured with SSL