Download This statistics in other country:
Timeline:
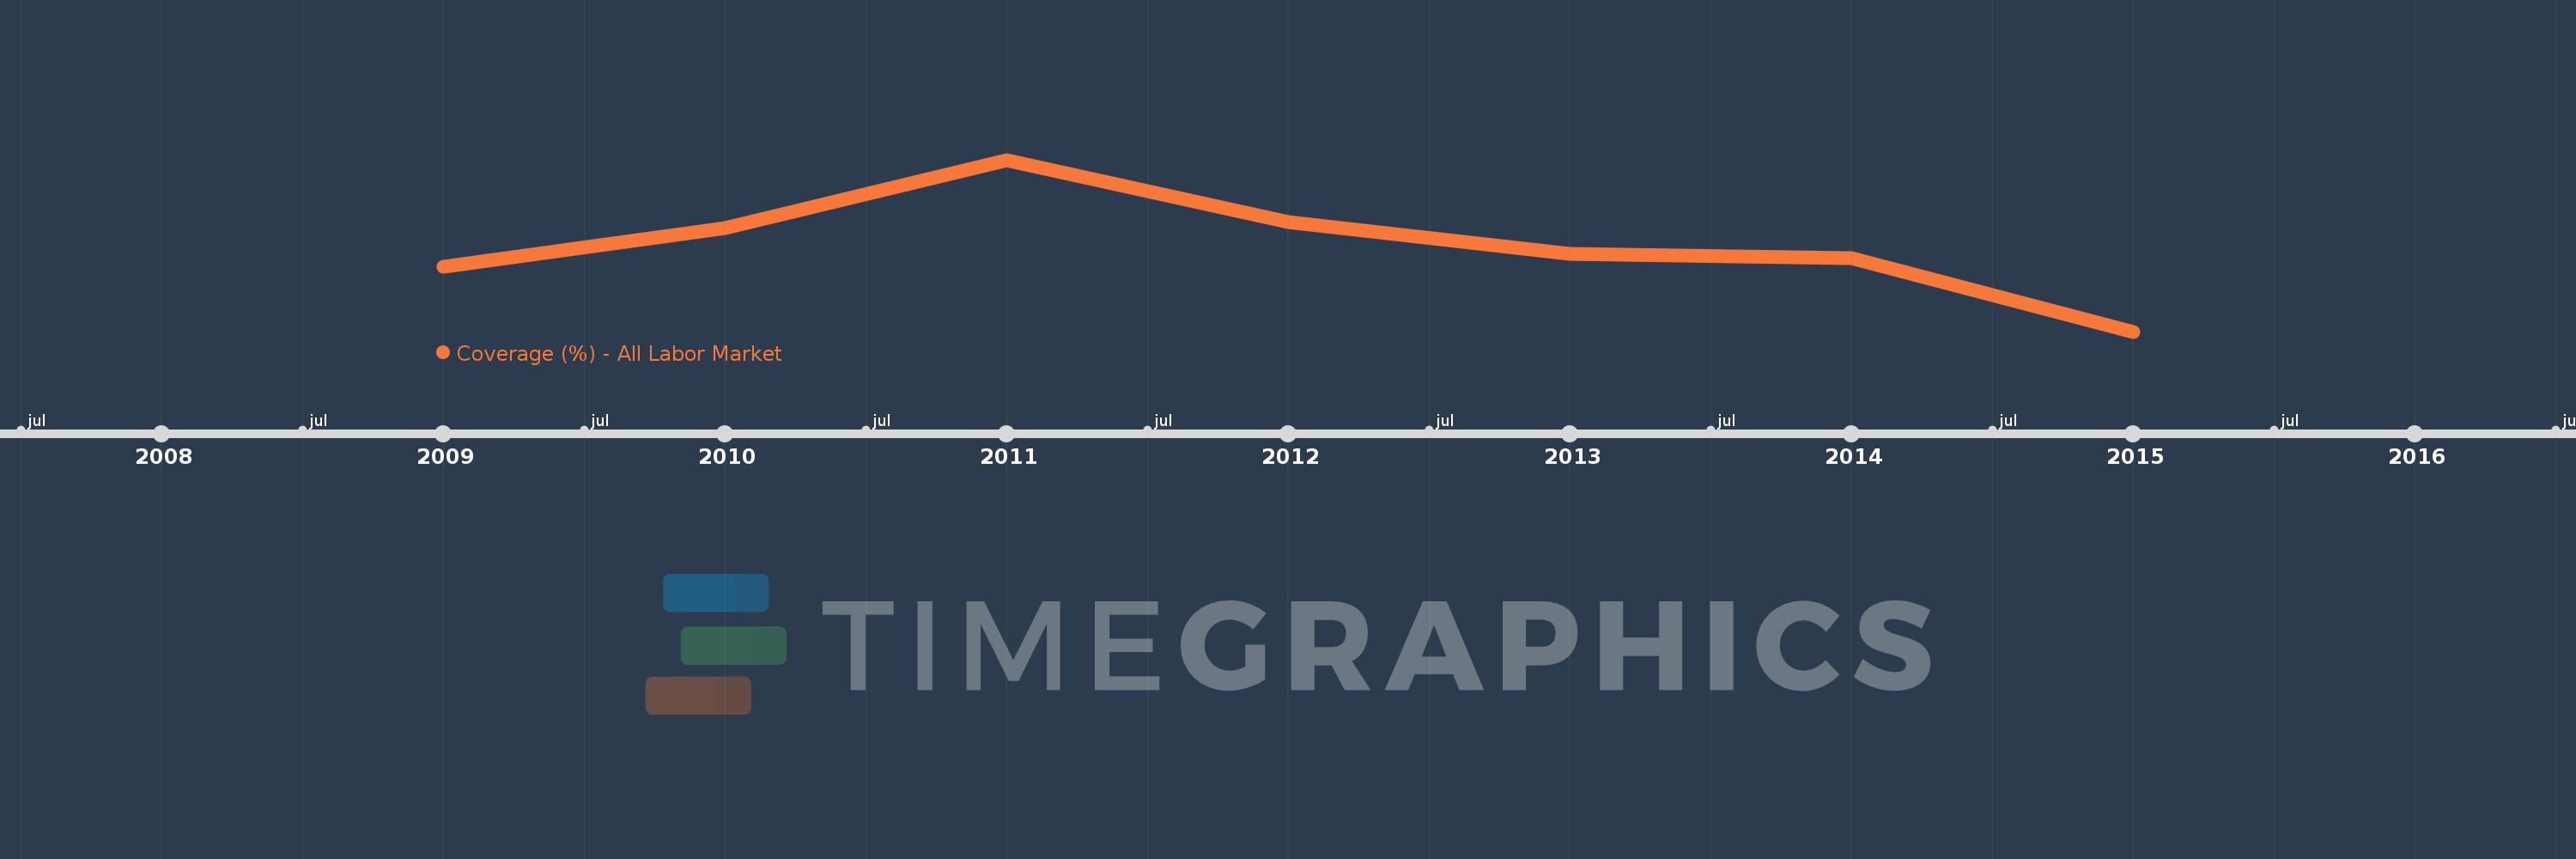
This timeline shows a graph from 2009 to 2015 of Armenia. No data until 2008. Number of actual observations by date: 7.
Source name:
World Development Indicators
Source organization:
The Atlas of Social Protection: Indicators of Resilience and Equity (ASPIRE)
Categories, topics:
Social Protection & Labor
Last updated:
apr 23, 2017
Indicators value changes by year
At the date of observation
Value
Absolute change
Change from the previous value
jan 1, 2009
2.941
+2.941
0.0%
jan 1, 2010
4.142
+1.201
40.85%
jan 1, 2011
6.298
+2.156
52.06%
jan 1, 2012
4.346
-1.953
-31.0%
jan 1, 2013
3.325
-1.021
-23.5%
jan 1, 2014
3.206
-0.119
-3.57%
jan 1, 2015
0.887
-2.319
-72.33%
Ranking of countries by current statistics by years