Download This statistics in other country:
Timeline:
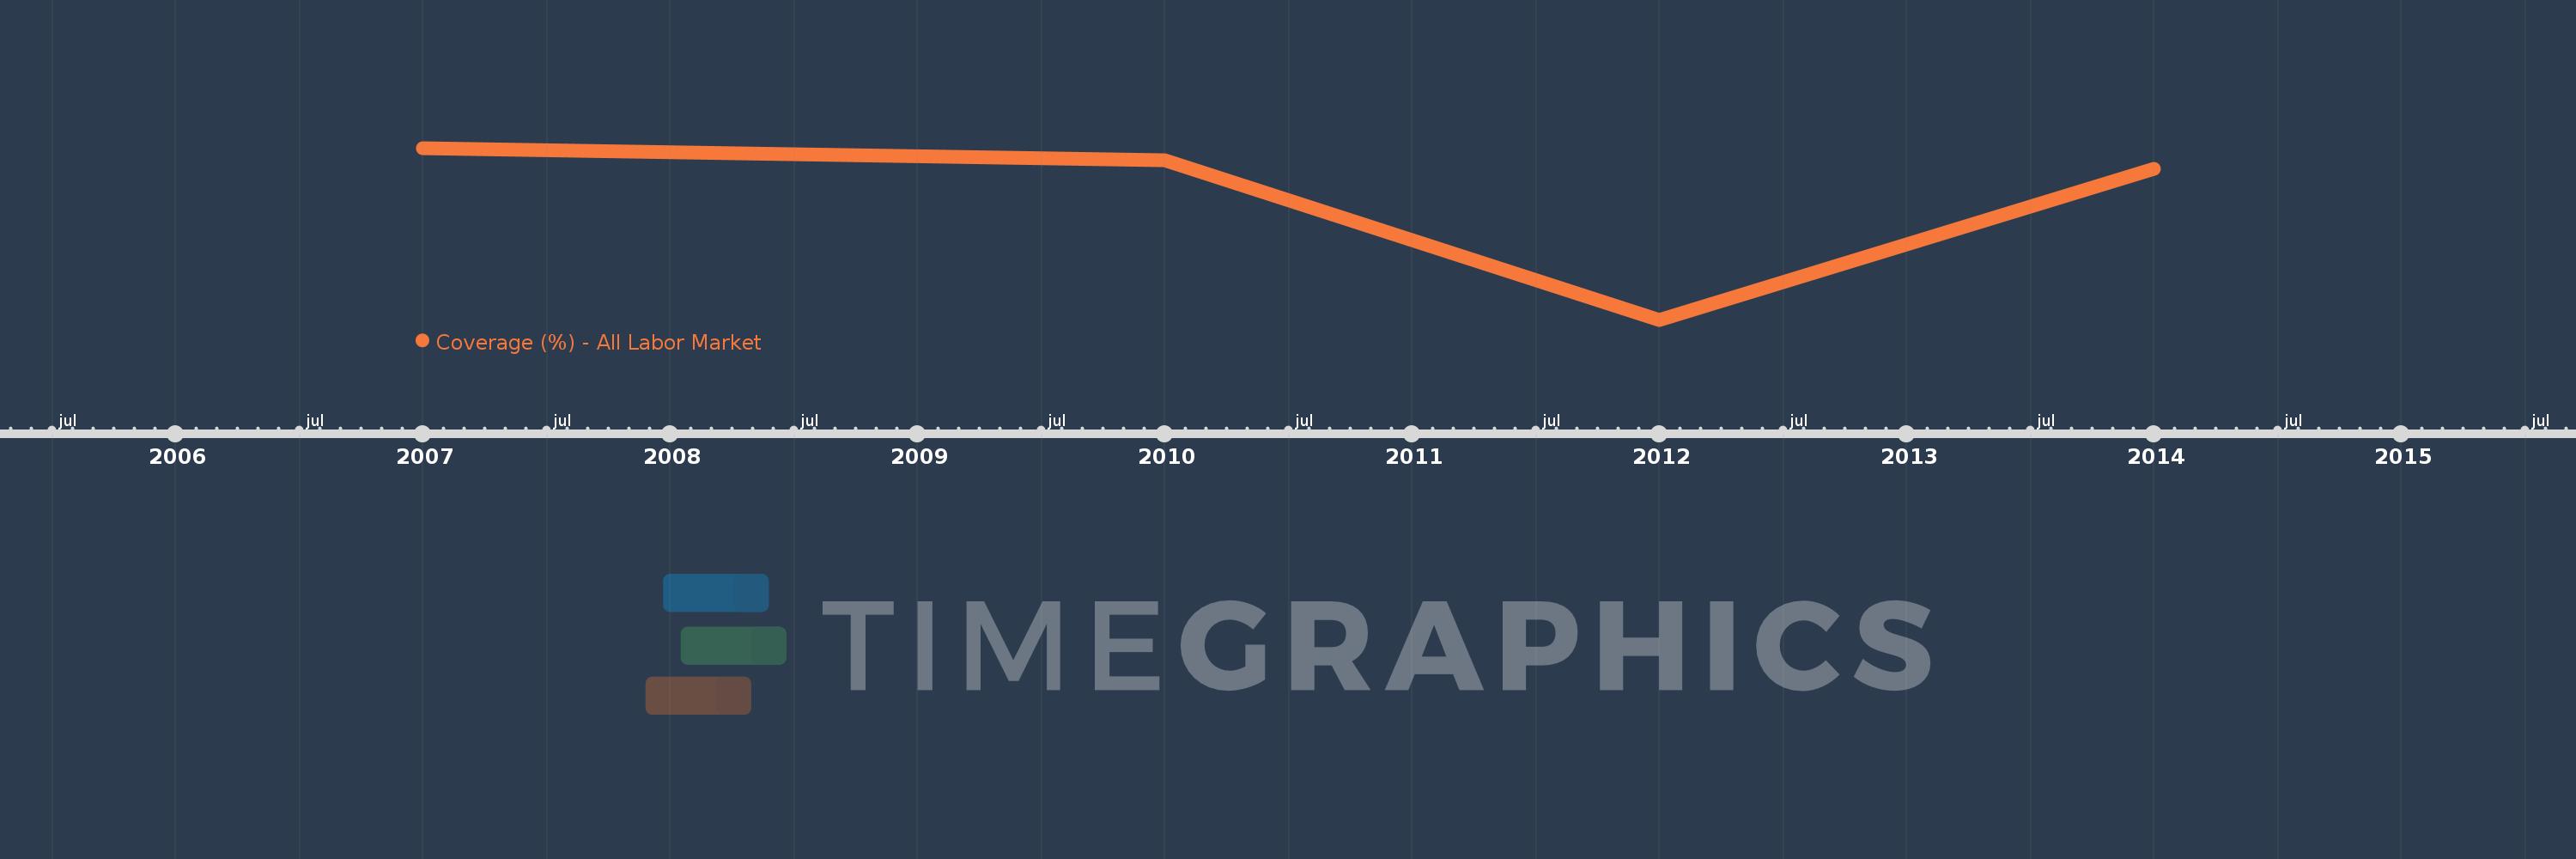
This timeline shows a graph from 2007 to 2014 of Chile. No data until 2006. Number of actual observations by date: 4.
Source name:
World Development Indicators
Source organization:
The Atlas of Social Protection: Indicators of Resilience and Equity (ASPIRE)
Categories, topics:
Social Protection & Labor
Last updated:
apr 23, 2017
Indicators value changes by year
Maximum:
23.403
jan 1, 2007
At the date of observation
Value
Absolute change
Change from the previous value
jan 1, 2007
23.403
+23.403
0.0%
jan 1, 2010
21.746
-1.657
-7.08%
jan 1, 2012
0.597
-21.149
-97.25%
jan 1, 2014
20.671
+20.073
3.36K%
Ranking of countries by current statistics by years