Download This statistics in other country:
Timeline:
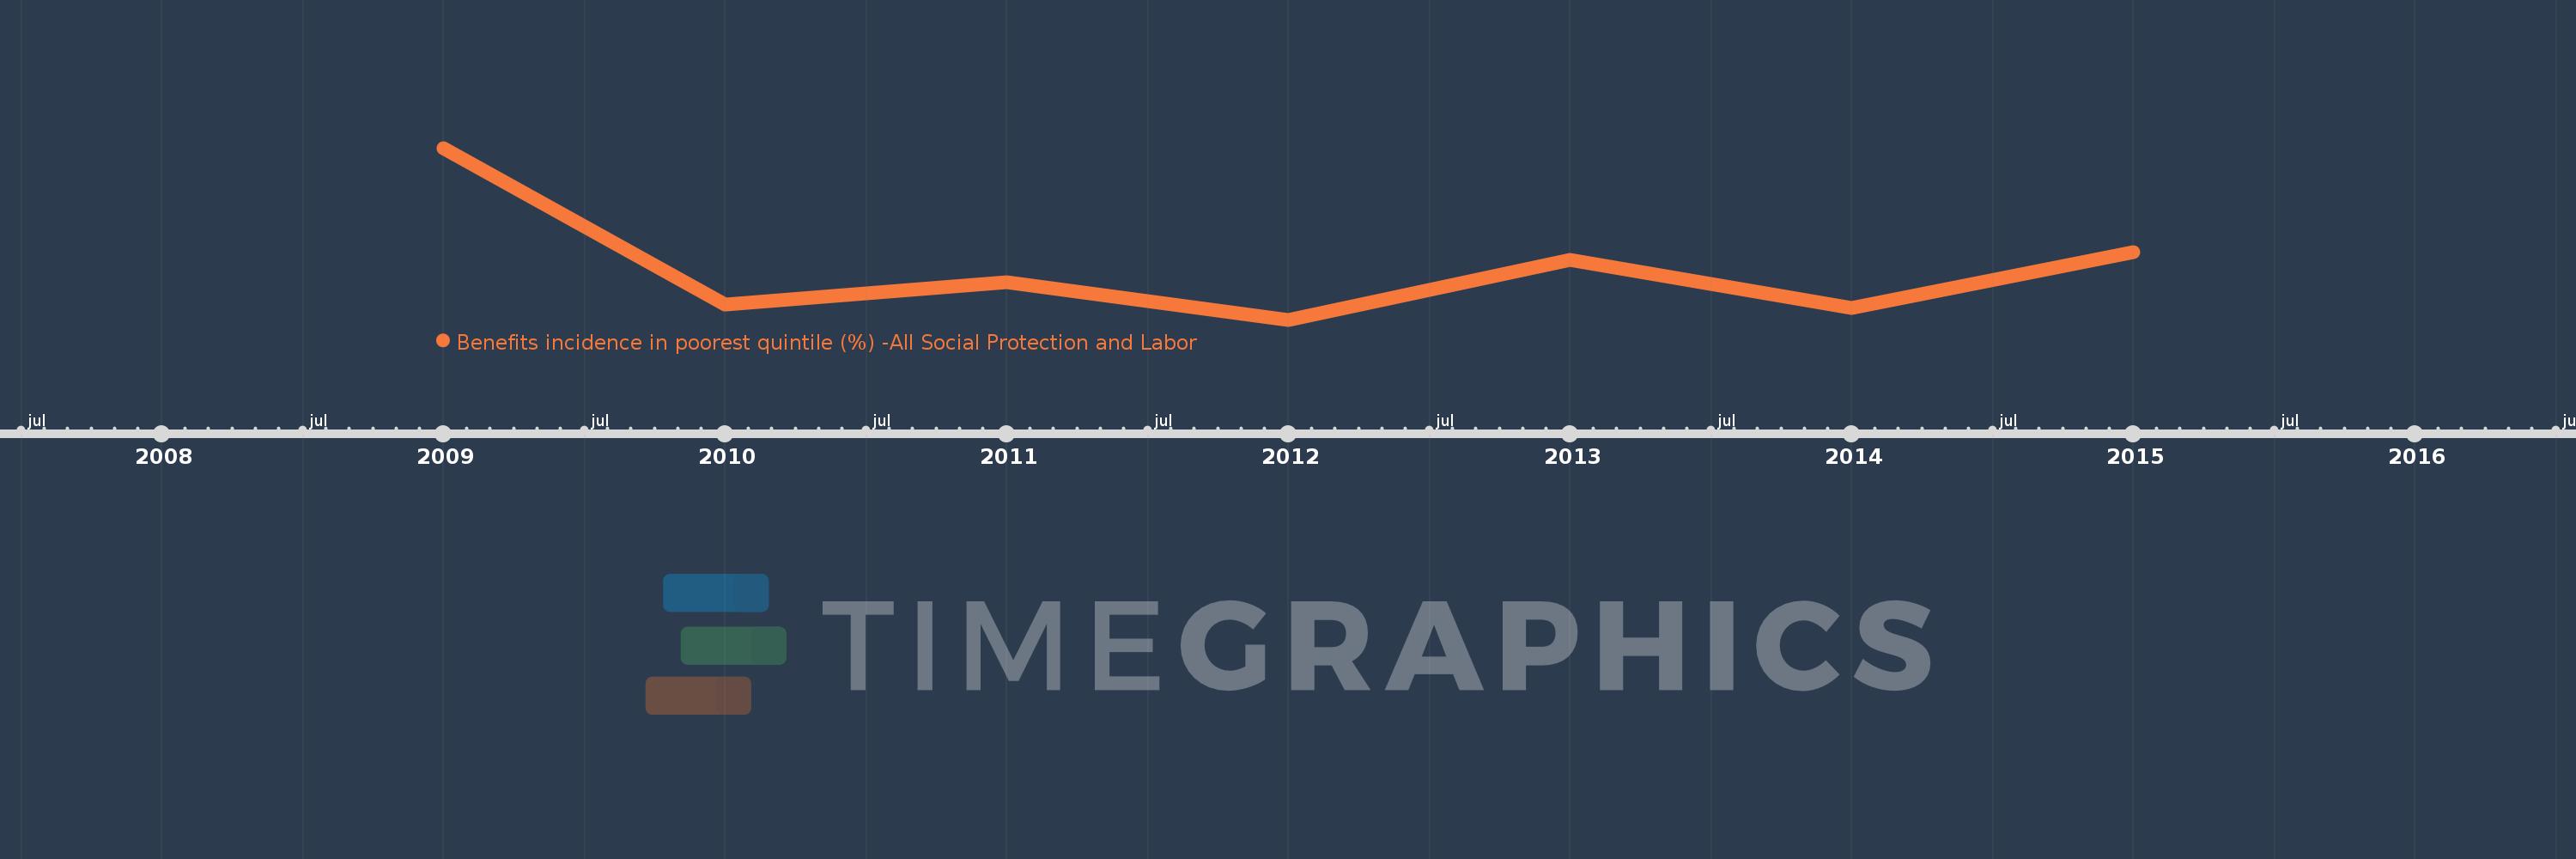
This timeline shows a graph from 2009 to 2015 of Armenia. No data until 2008. Number of actual observations by date: 7.
Source name:
World Development Indicators
Source organization:
The Atlas of Social Protection: Indicators of Resilience and Equity (ASPIRE)
Categories, topics:
Social Protection & Labor
Last updated:
apr 23, 2017
Indicators value changes by year
Minimum:
16.397
jan 1, 2012
Maximum:
19.945
jan 1, 2009
At the date of observation
Value
Absolute change
Change from the previous value
jan 1, 2009
19.945
+19.945
0.0%
jan 1, 2010
16.706
-3.238
-16.24%
jan 1, 2011
17.165
+0.459
2.75%
jan 1, 2012
16.397
-0.769
-4.48%
jan 1, 2013
17.635
+1.238
7.55%
jan 1, 2014
16.637
-0.997
-5.65%
jan 1, 2015
17.792
+1.155
6.94%
Ranking of countries by current statistics by years