Download This statistics in other country:
Timeline:
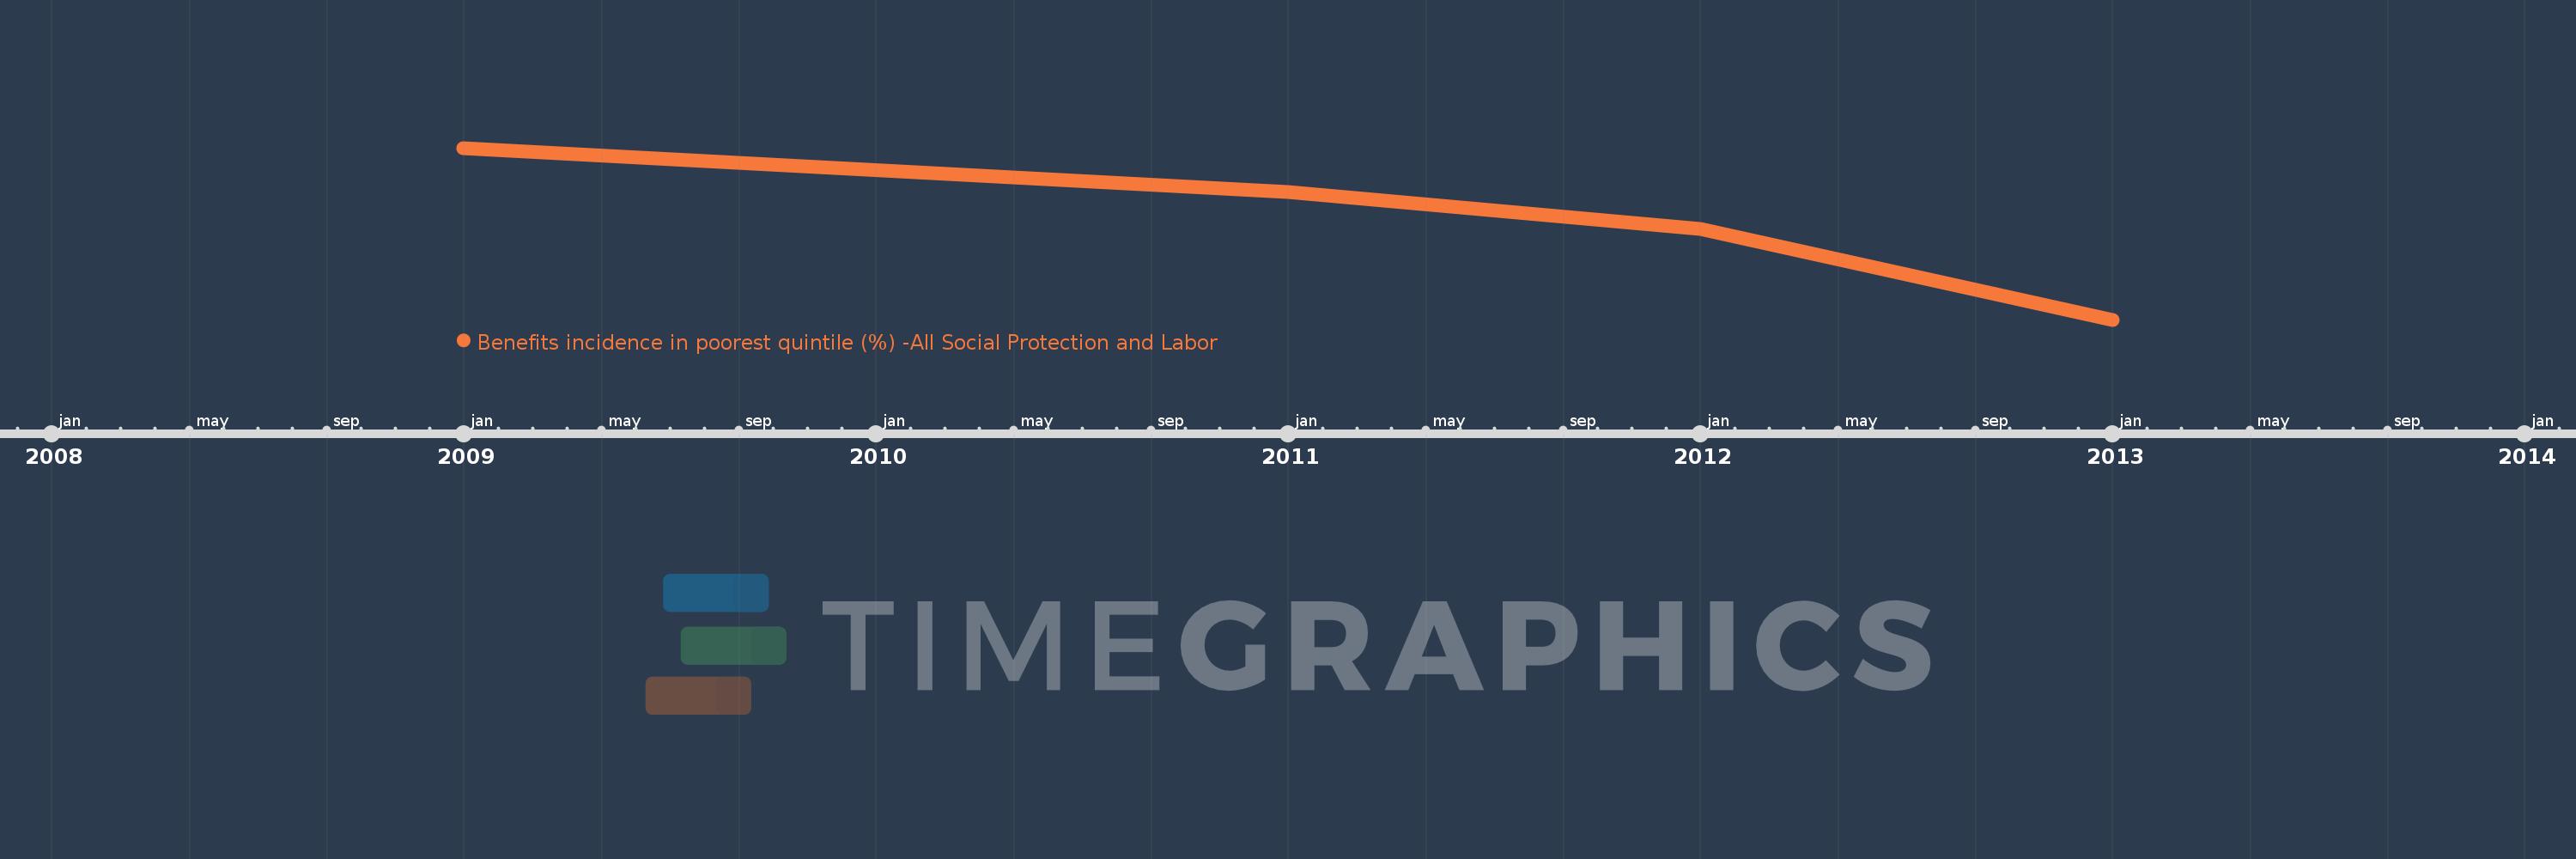
This timeline shows a graph from 2009 to 2013 of Costa Rica. No data until 2008. Number of actual observations by date: 4.
Source name:
World Development Indicators
Source organization:
The Atlas of Social Protection: Indicators of Resilience and Equity (ASPIRE)
Categories, topics:
Social Protection & Labor
Last updated:
apr 23, 2017
Indicators value changes by year
At the date of observation
Value
Absolute change
Change from the previous value
jan 1, 2009
5.749
+5.749
0.0%
jan 1, 2011
5.663
-0.087
-1.51%
jan 1, 2012
5.59
-0.073
-1.29%
jan 1, 2013
5.413
-0.177
-3.17%
Ranking of countries by current statistics by years