33
/
AIzaSyB4mHJ5NPEv-XzF7P6NDYXjlkCWaeKw5bc
November 30, 2025
69400
Argentina
ARG
true
2
1
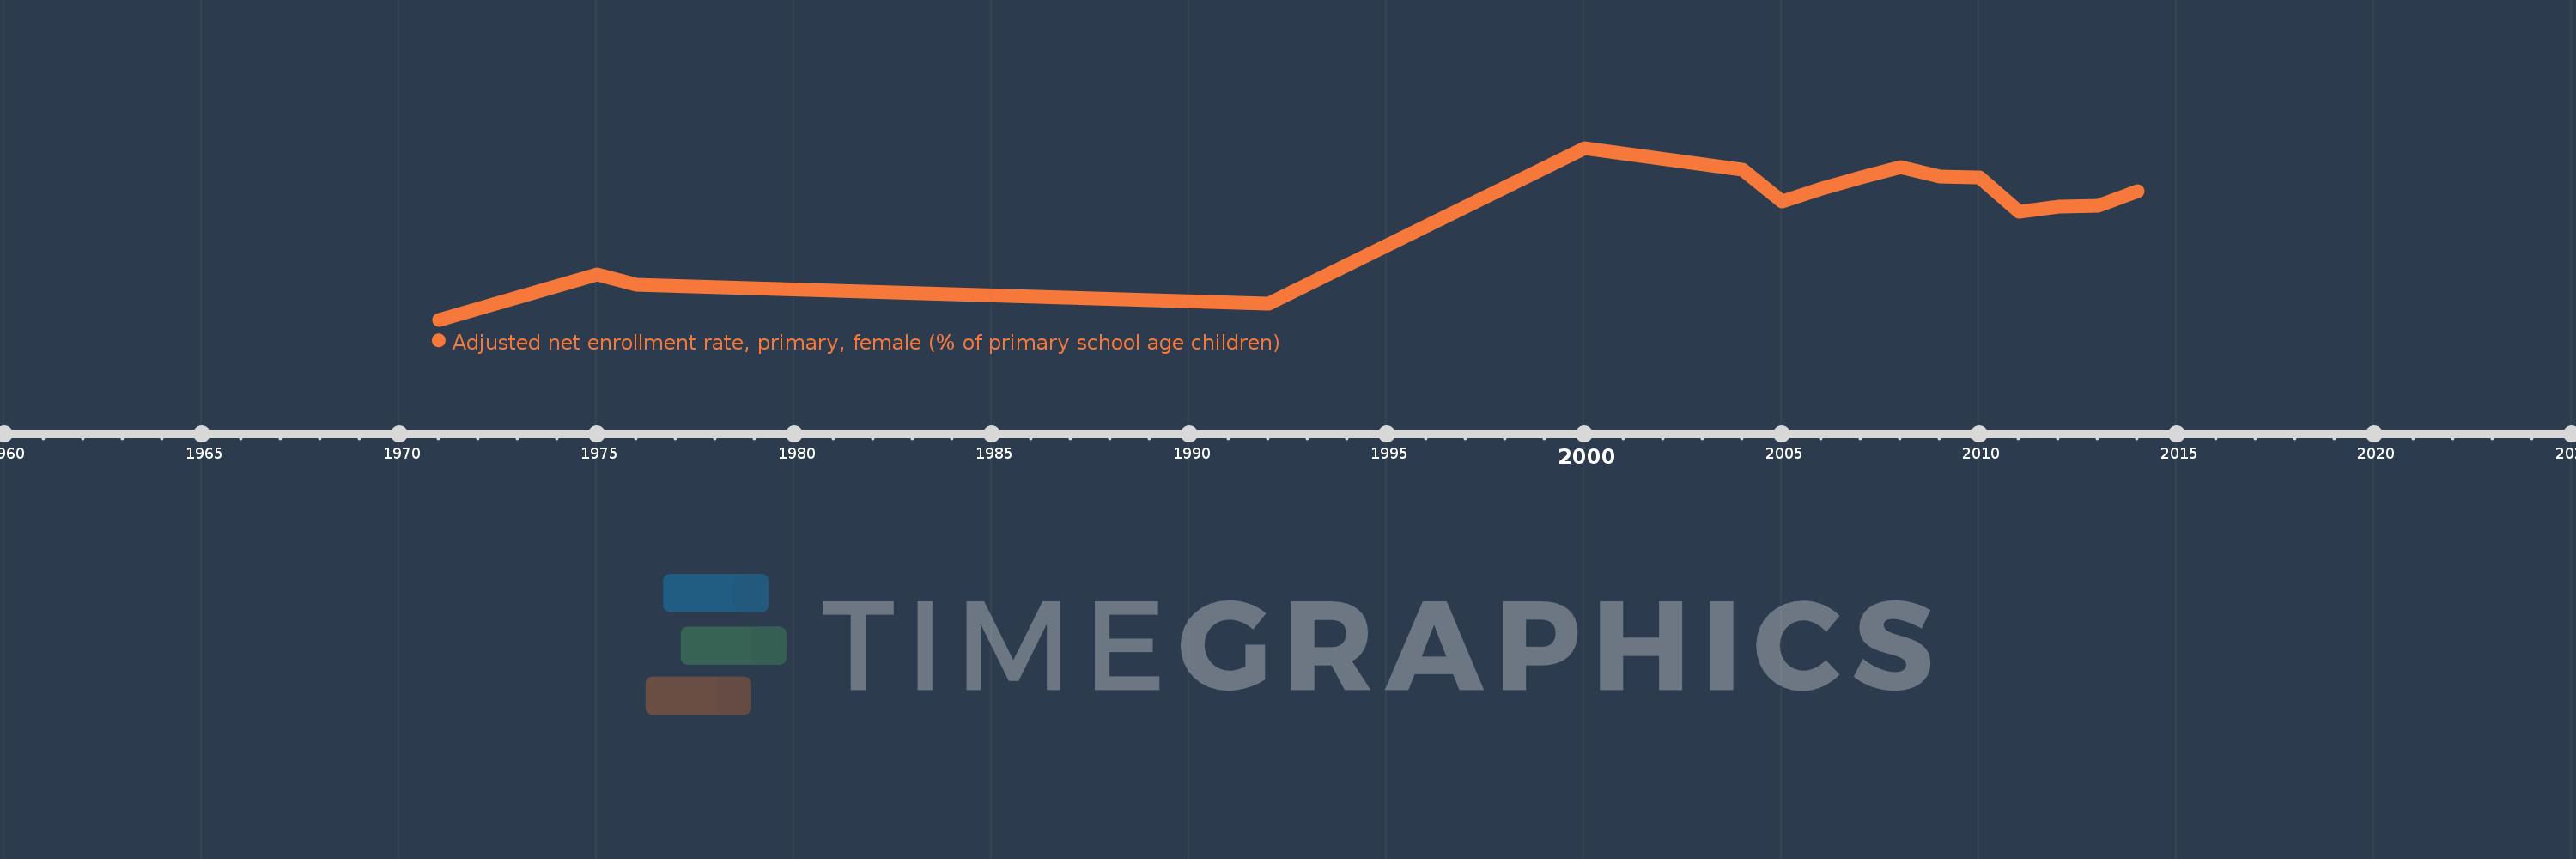
Adjusted net enrollment rate, primary, female (% of primary school age children)
2014,2013,2012,2011,2010,2009,2008,2007,2006,2005,2004,2000,1992,1976,1975,1971