33
/
AIzaSyB4mHJ5NPEv-XzF7P6NDYXjlkCWaeKw5bc
November 30, 2025
123058
Ecuador
ECU
true
2
1
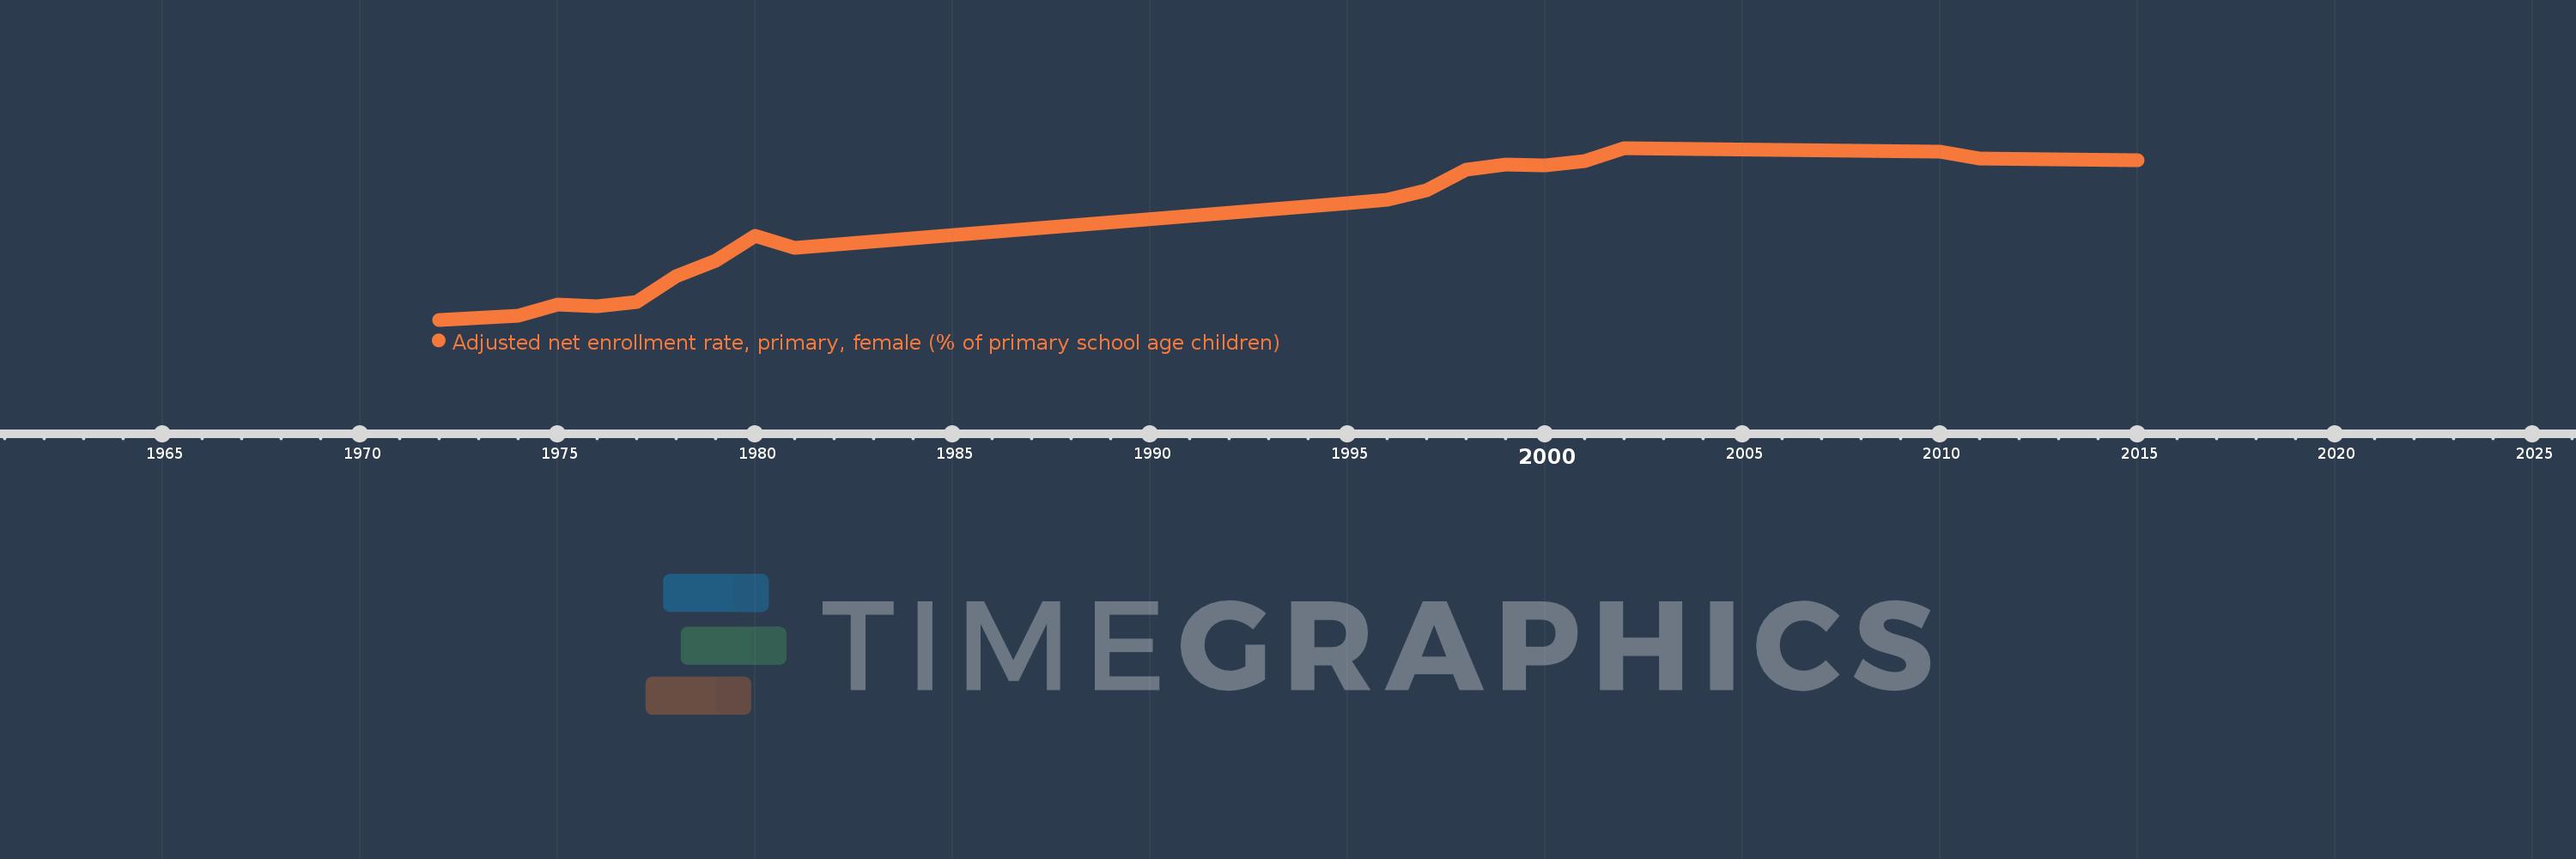
Adjusted net enrollment rate, primary, female (% of primary school age children)
2015,2011,2010,2002,2001,2000,1999,1998,1997,1996,1995,1981,1980,1979,1978,1977,1976,1975,1974,1972