33
/
AIzaSyB4mHJ5NPEv-XzF7P6NDYXjlkCWaeKw5bc
November 30, 2025
66528
Algeria
DZA
true
2
1
PPG, bonds (INT, current US$)
1996,1995,1994,1993,1992,1991,1990,1989,1988,1987,1986,1985,1984,1983,1982,1981,1980,1979,1978,1977,1976,1975,1974,1973
Create a timeline
Public Timelines
For education
For educational institutions
For teachers
For students
Cabinet
For educational institutions
For teachers
For students
Open cabinet
FAQ
Close
Create a timeline
Public timelines
FAQ
About & Feedback
Terms
Privacy
FAQ
Support 24/7
Cabinet
Get premium
Donate
Download
Global statistics library
→
Algeria
→
PPG, bonds (INT, current US$)
This statistics in other country:
Albania
Algeria
Angola
Argentina
Armenia
Azerbaijan
Belarus
Belize
Benin
Bolivia
Bosnia and Herzegovina
Botswana
Brazil
Bulgaria
Burkina Faso
Cameroon
China
Colombia
Congo, Dem. Rep.
Congo, Rep.
Costa Rica
Cote d'Ivoire
Dominica
Dominican Republic
East Asia & Pacific (excluding high income)
Ecuador
Egypt, Arab Rep.
El Salvador
Ethiopia
Europe & Central Asia (excluding high income)
Fiji
Gabon
Georgia
Ghana
Grenada
Guatemala
Guinea
Guyana
Honduras
IDA only
India
Indonesia
Jamaica
Jordan
Kazakhstan
Kenya
Lao PDR
Latin America & Caribbean (excluding high income)
Lebanon
Low & middle income
Low income
Lower middle income
Macedonia, FYR
Malawi
Malaysia
Mauritania
Mauritius
Mexico
Middle East & North Africa (excluding high income)
Middle income
Moldova
Mongolia
Montenegro
Morocco
Mozambique
Nicaragua
Niger
Nigeria
Pakistan
Panama
Papua New Guinea
Paraguay
Peru
Philippines
Romania
Russian Federation
Rwanda
Samoa
Senegal
Serbia
Sierra Leone
South Africa
South Asia
Sri Lanka
St. Lucia
St. Vincent and the Grenadines
Sub-Saharan Africa (excluding high income)
Sudan
Thailand
Togo
Tunisia
Turkey
Uganda
Ukraine
Upper middle income
Venezuela, RB
Vietnam
Zambia
Zimbabwe
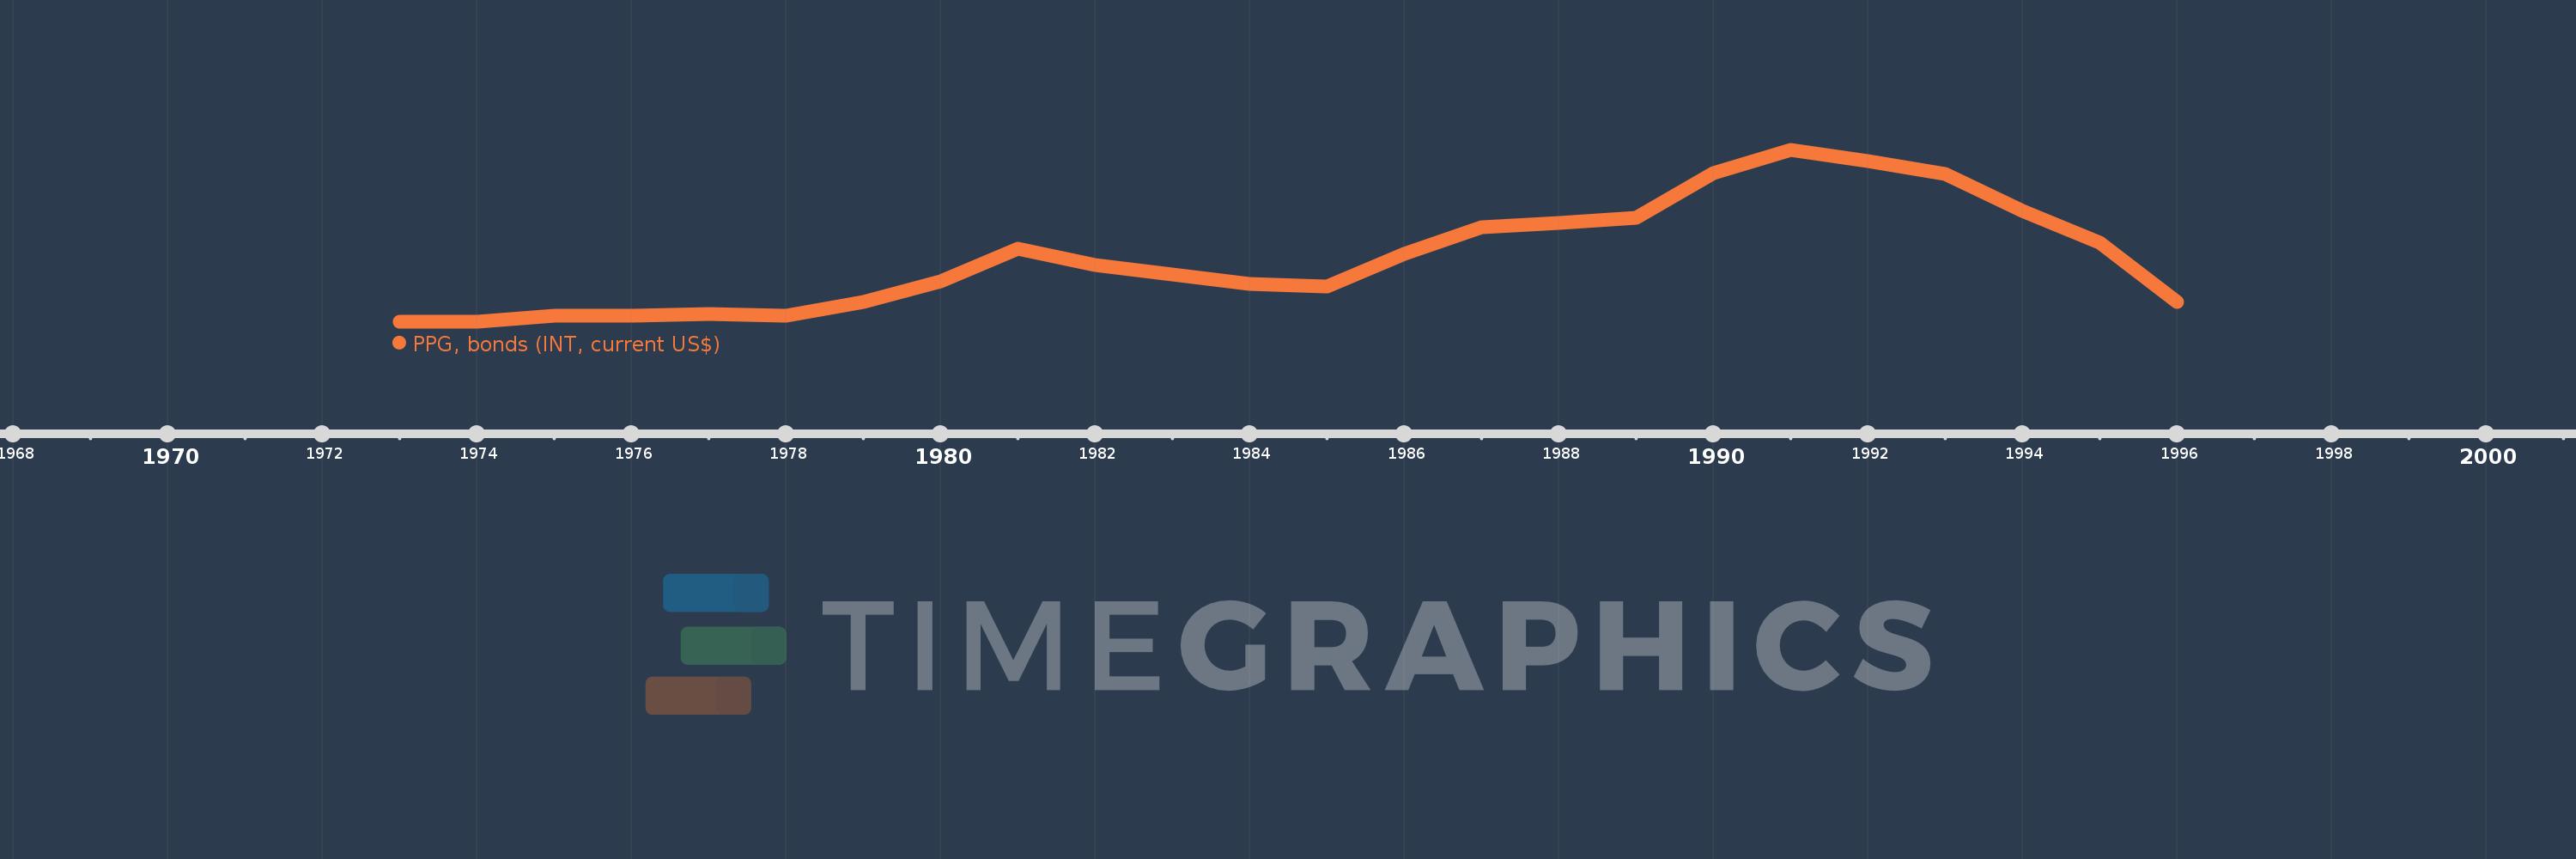
Timeline:
This timeline shows a graph from
1973
to
1996
of Algeria. No data until
1972
. Number of actual observations by date:
24
.
Source name:
World Development Indicators
Source organization:
World Bank, International Debt Statistics.
Categories, topics:
External Debt
Last updated:
apr 23, 2017
Indicators value changes by year
Meaning:
39.375 mln
Minimum:
216.0K
jan 1, 1973
Maximum:
104.691 mln
jan 1, 1991
At the date of observation
Value
Absolute change
Change from the previous value
jan 1, 1973
216.0K
+216.0K
0.0%
jan 1, 1974
225.0K
+9.0K
4.17%
jan 1, 1975
4.169 mln
+3.944 mln
1.75K%
jan 1, 1976
4.15 mln
-19.0K
-0.46%
jan 1, 1977
5.005 mln
+855.0K
20.6%
jan 1, 1978
4.094 mln
-911.0K
-18.2%
jan 1, 1979
12.177 mln
+8.083 mln
197.44%
jan 1, 1980
24.94 mln
+12.763 mln
104.81%
jan 1, 1981
44.977 mln
+20.037 mln
80.34%
jan 1, 1982
35.056 mln
-9.921 mln
-22.06%
jan 1, 1983
28.973 mln
-6.083 mln
-17.35%
jan 1, 1984
23.302 mln
-5.671 mln
-19.57%
jan 1, 1985
21.632 mln
-1.67 mln
-7.17%
jan 1, 1986
41.769 mln
+20.137 mln
93.09%
jan 1, 1987
57.606 mln
+15.837 mln
37.92%
jan 1, 1988
60.325 mln
+2.719 mln
4.72%
jan 1, 1989
63.396 mln
+3.071 mln
5.09%
jan 1, 1990
90.867 mln
+27.471 mln
43.33%
jan 1, 1991
104.691 mln
+13.824 mln
15.21%
jan 1, 1992
98.009 mln
-6.682 mln
-6.38%
jan 1, 1993
90.349 mln
-7.66 mln
-7.82%
jan 1, 1994
67.903 mln
-22.446 mln
-24.84%
jan 1, 1995
48.546 mln
-19.357 mln
-28.51%
jan 1, 1996
12.622 mln
-35.924 mln
-74.0%
Ranking of countries by current statistics by years
About & Feedback
Terms
Privacy
FAQ
Support 24/7
Cabinet
Get premium
Donate
The service accepts bank transfer (ACH, Wire) or cards (Visa, MasterCard, etc). Processed by Stripe.
Secured with SSL