33
/
AIzaSyB4mHJ5NPEv-XzF7P6NDYXjlkCWaeKw5bc
November 30, 2025
246131
South Africa
ZAF
true
2
1
PPG, bonds (INT, current US$)
2017,2016,2015,2014,2013,2012,2011,2010,2009,2008,2007,2006,2005,2004,2003,2002,2001,2000,1999,1998,1997,1996,1995
Create a timeline
Public Timelines
For education
For educational institutions
For teachers
For students
Cabinet
For educational institutions
For teachers
For students
Open cabinet
FAQ
Close
Create a timeline
Public timelines
FAQ
About & Feedback
Terms
Privacy
FAQ
Support 24/7
Cabinet
Get premium
Donate
Download
Global statistics library
→
South Africa
→
PPG, bonds (INT, current US$)
This statistics in other country:
Albania
Algeria
Angola
Argentina
Armenia
Azerbaijan
Belarus
Belize
Benin
Bolivia
Bosnia and Herzegovina
Botswana
Brazil
Bulgaria
Burkina Faso
Cameroon
China
Colombia
Congo, Dem. Rep.
Congo, Rep.
Costa Rica
Cote d'Ivoire
Dominica
Dominican Republic
East Asia & Pacific (excluding high income)
Ecuador
Egypt, Arab Rep.
El Salvador
Ethiopia
Europe & Central Asia (excluding high income)
Fiji
Gabon
Georgia
Ghana
Grenada
Guatemala
Guinea
Guyana
Honduras
IDA only
India
Indonesia
Jamaica
Jordan
Kazakhstan
Kenya
Lao PDR
Latin America & Caribbean (excluding high income)
Lebanon
Low & middle income
Low income
Lower middle income
Macedonia, FYR
Malawi
Malaysia
Mauritania
Mauritius
Mexico
Middle East & North Africa (excluding high income)
Middle income
Moldova
Mongolia
Montenegro
Morocco
Mozambique
Nicaragua
Niger
Nigeria
Pakistan
Panama
Papua New Guinea
Paraguay
Peru
Philippines
Romania
Russian Federation
Rwanda
Samoa
Senegal
Serbia
Sierra Leone
South Africa
South Asia
Sri Lanka
St. Lucia
St. Vincent and the Grenadines
Sub-Saharan Africa (excluding high income)
Sudan
Thailand
Togo
Tunisia
Turkey
Uganda
Ukraine
Upper middle income
Venezuela, RB
Vietnam
Zambia
Zimbabwe
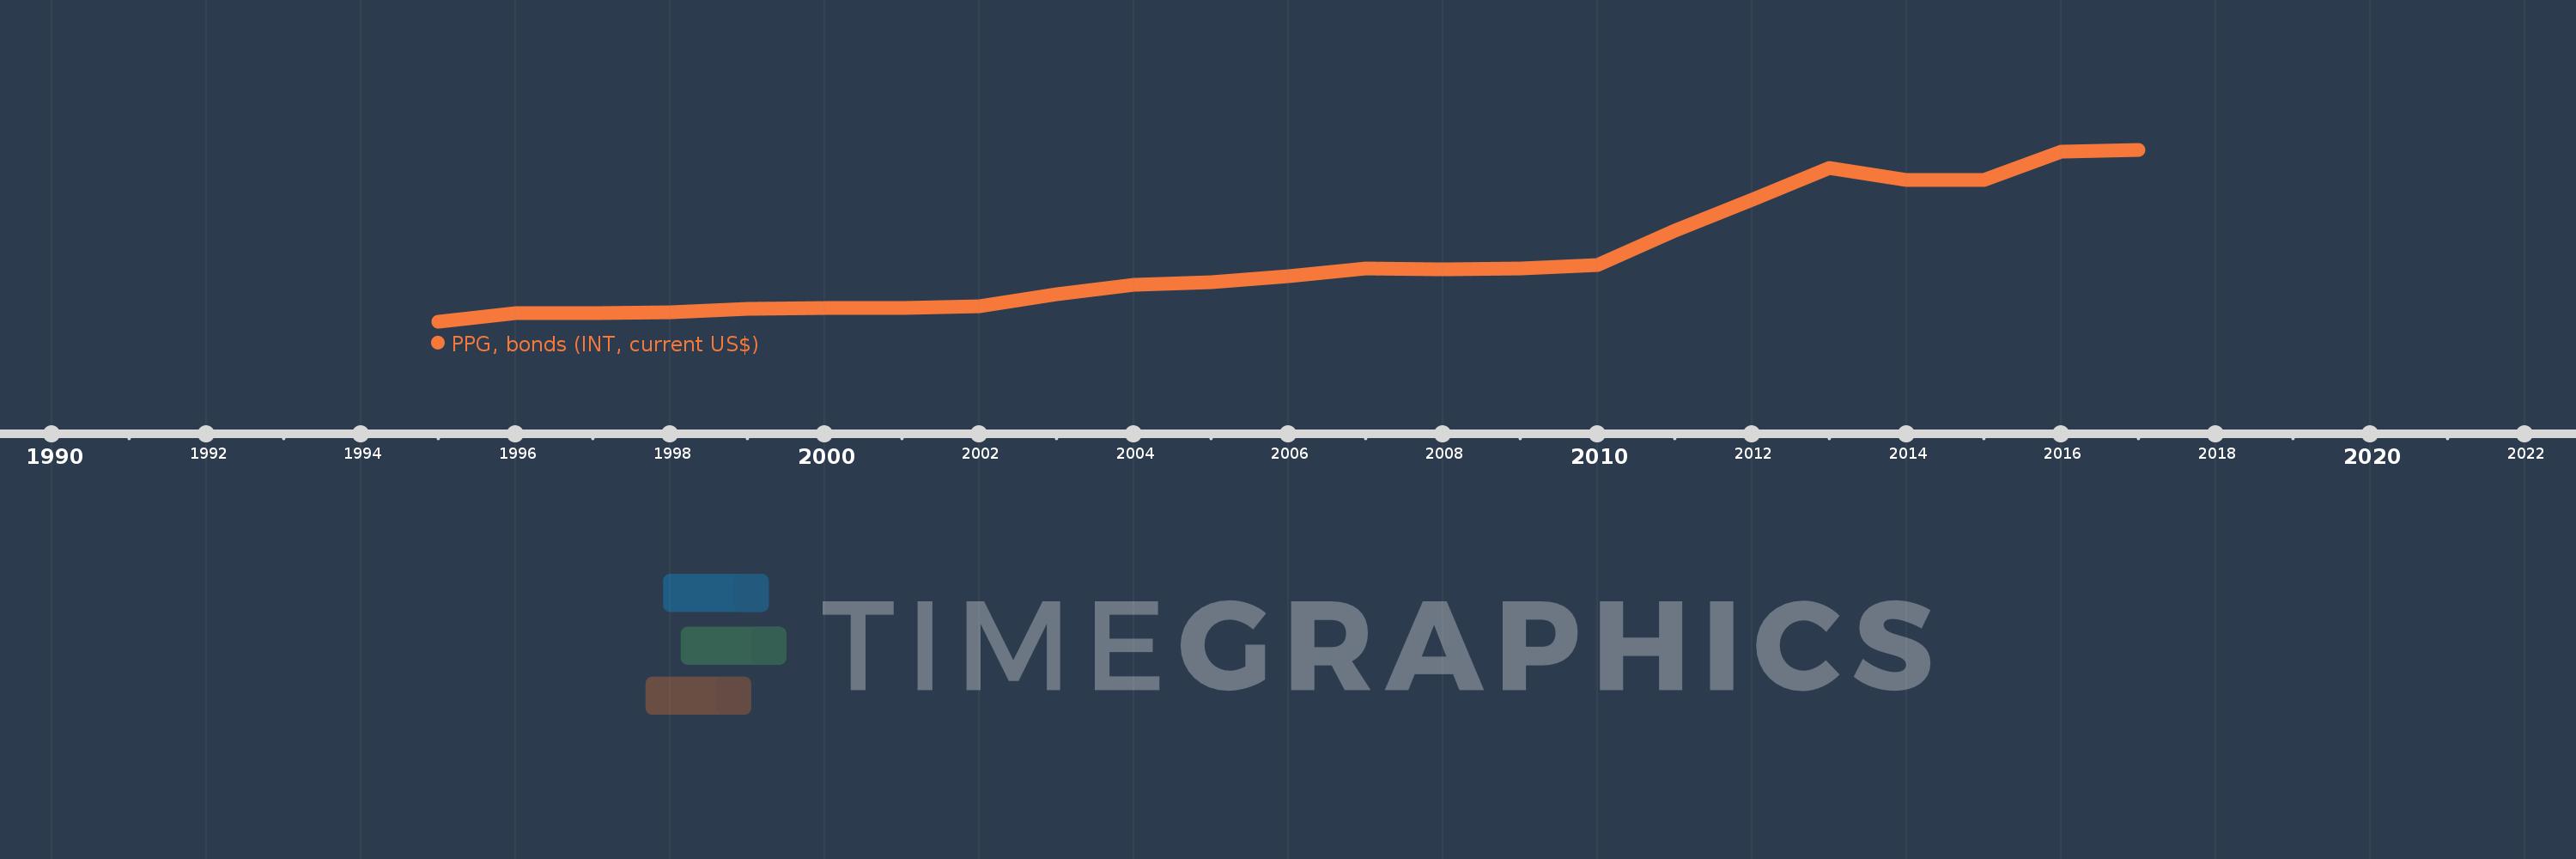
Timeline:
This timeline shows a graph from
1995
to
2017
of South Africa. No data until
1994
. Number of actual observations by date:
23
.
Source name:
World Development Indicators
Source organization:
World Bank, International Debt Statistics.
Categories, topics:
External Debt
Last updated:
apr 23, 2017
Indicators value changes by year
Meaning:
1.041 bln
Minimum:
55.73 mln
jan 1, 1995
Maximum:
2.75 bln
jan 1, 2017
At the date of observation
Value
Absolute change
Change from the previous value
jan 1, 1995
55.73 mln
+55.73 mln
0.0%
jan 1, 1996
188.246 mln
+132.516 mln
237.78%
jan 1, 1997
193.841 mln
+5.595 mln
2.97%
jan 1, 1998
206.627 mln
+12.786 mln
6.6%
jan 1, 1999
268.103 mln
+61.476 mln
29.75%
jan 1, 2000
269.845 mln
+1.742 mln
0.65%
jan 1, 2001
278.12 mln
+8.275 mln
3.07%
jan 1, 2002
307.125 mln
+29.005 mln
10.43%
jan 1, 2003
489.666 mln
+182.541 mln
59.44%
jan 1, 2004
638.099 mln
+148.433 mln
30.31%
jan 1, 2005
685.821 mln
+47.722 mln
7.48%
jan 1, 2006
770.512 mln
+84.691 mln
12.35%
jan 1, 2007
896.277 mln
+125.765 mln
16.32%
jan 1, 2008
884.57 mln
-11.707 mln
-1.31%
jan 1, 2009
894.301 mln
+9.731 mln
1.1%
jan 1, 2010
952.922 mln
+58.621 mln
6.55%
jan 1, 2011
1.488 bln
+535.295 mln
56.17%
jan 1, 2012
1.968 bln
+480.06 mln
32.26%
jan 1, 2013
2.475 bln
+506.409 mln
25.73%
jan 1, 2014
2.278 bln
-197.138 mln
-7.97%
jan 1, 2015
2.276 bln
-1.048 mln
-0.05%
jan 1, 2016
2.72 bln
+443.727 mln
19.49%
jan 1, 2017
2.75 bln
+29.485 mln
1.08%
Ranking of countries by current statistics by years
About & Feedback
Terms
Privacy
FAQ
Support 24/7
Cabinet
Get premium
Donate
The service accepts bank transfer (ACH, Wire) or cards (Visa, MasterCard, etc). Processed by Stripe.
Secured with SSL