33
/
AIzaSyB4mHJ5NPEv-XzF7P6NDYXjlkCWaeKw5bc
November 30, 2025
63555
Afghanistan
AFG
true
2
1
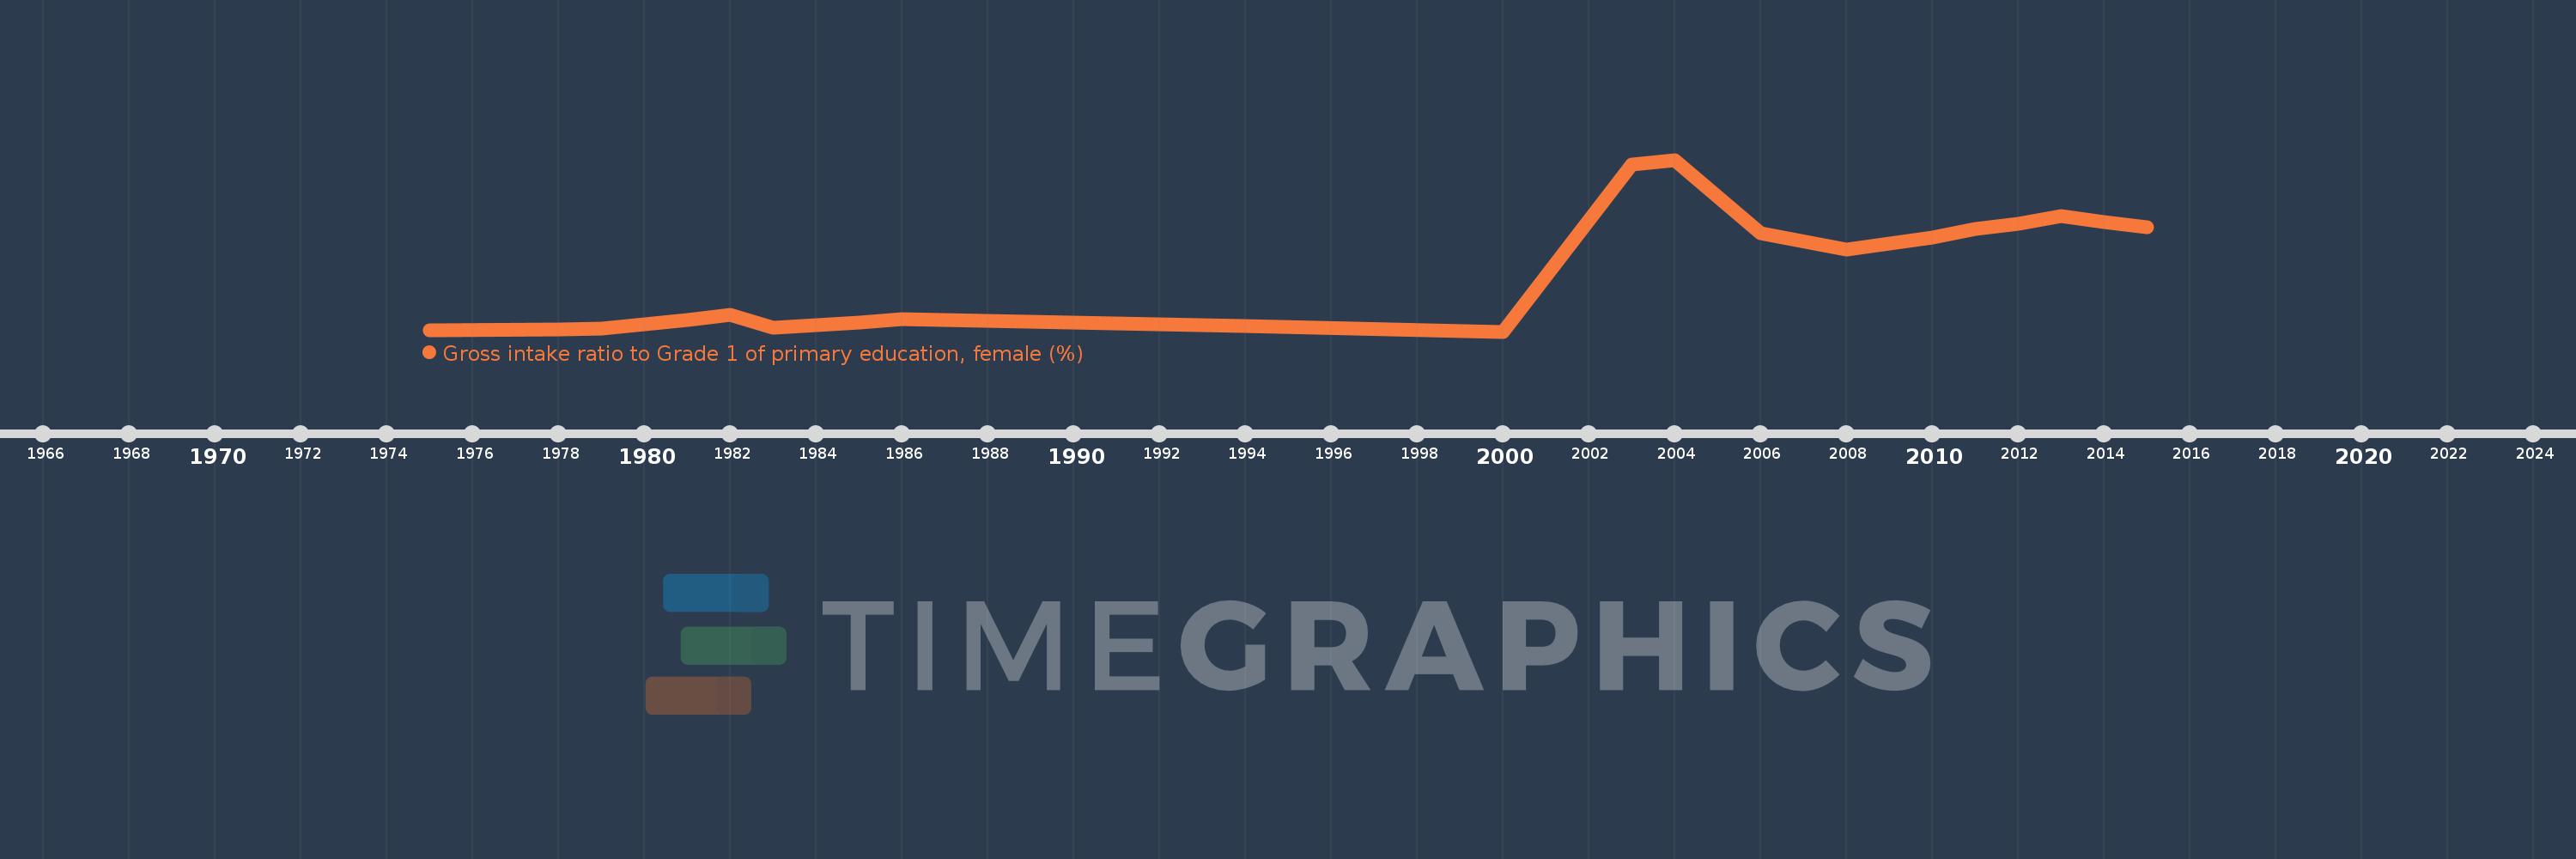
Gross intake ratio to Grade 1 of primary education, female (%)
2015,2014,2013,2012,2011,2010,2008,2006,2004,2003,2000,1994,1986,1985,1983,1982,1981,1979,1978,1975