33
/
AIzaSyB4mHJ5NPEv-XzF7P6NDYXjlkCWaeKw5bc
November 30, 2025
247611
Spain
ESP
true
2
1
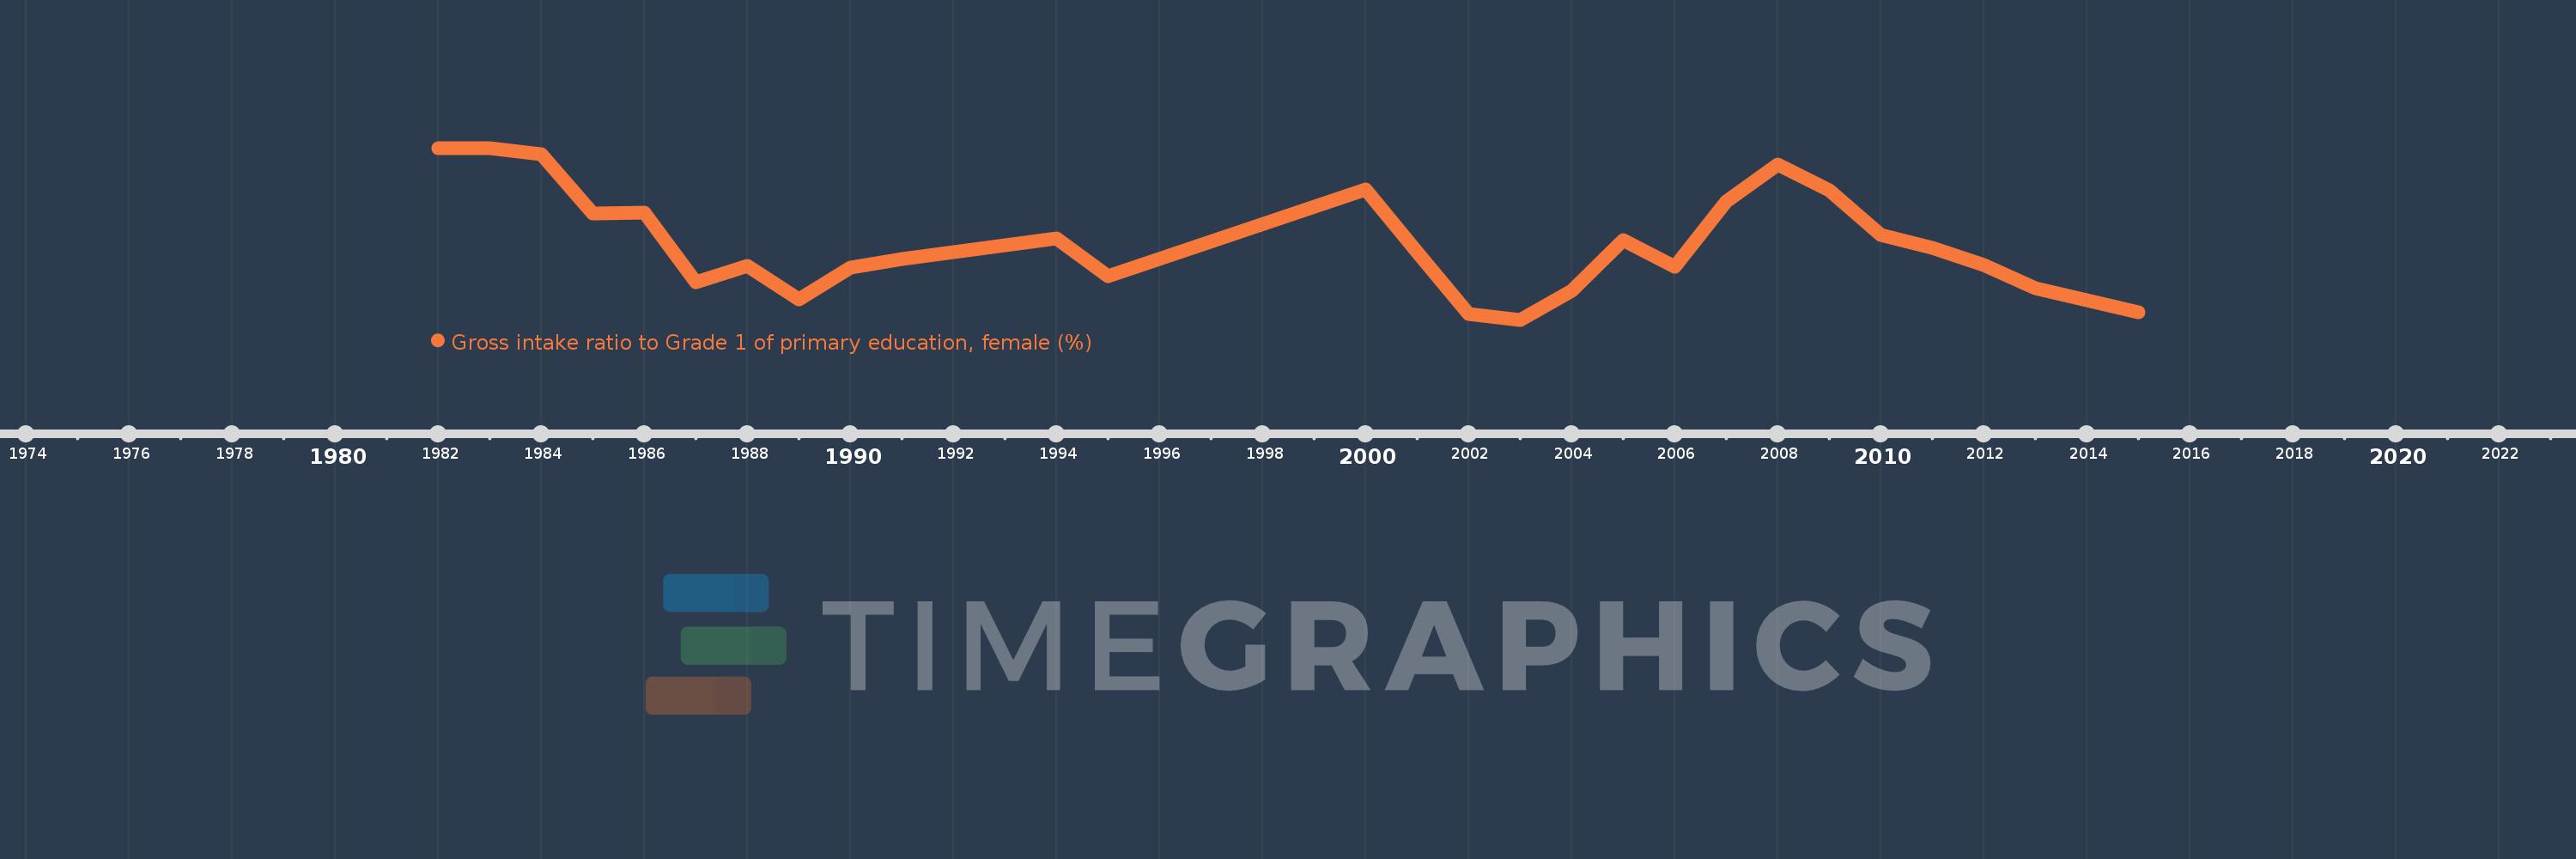
Gross intake ratio to Grade 1 of primary education, female (%)
2015,2013,2012,2011,2010,2009,2008,2007,2006,2005,2004,2003,2002,2001,2000,1995,1994,1991,1990,1989,1988,1987,1986,1985,1984,1983,1982