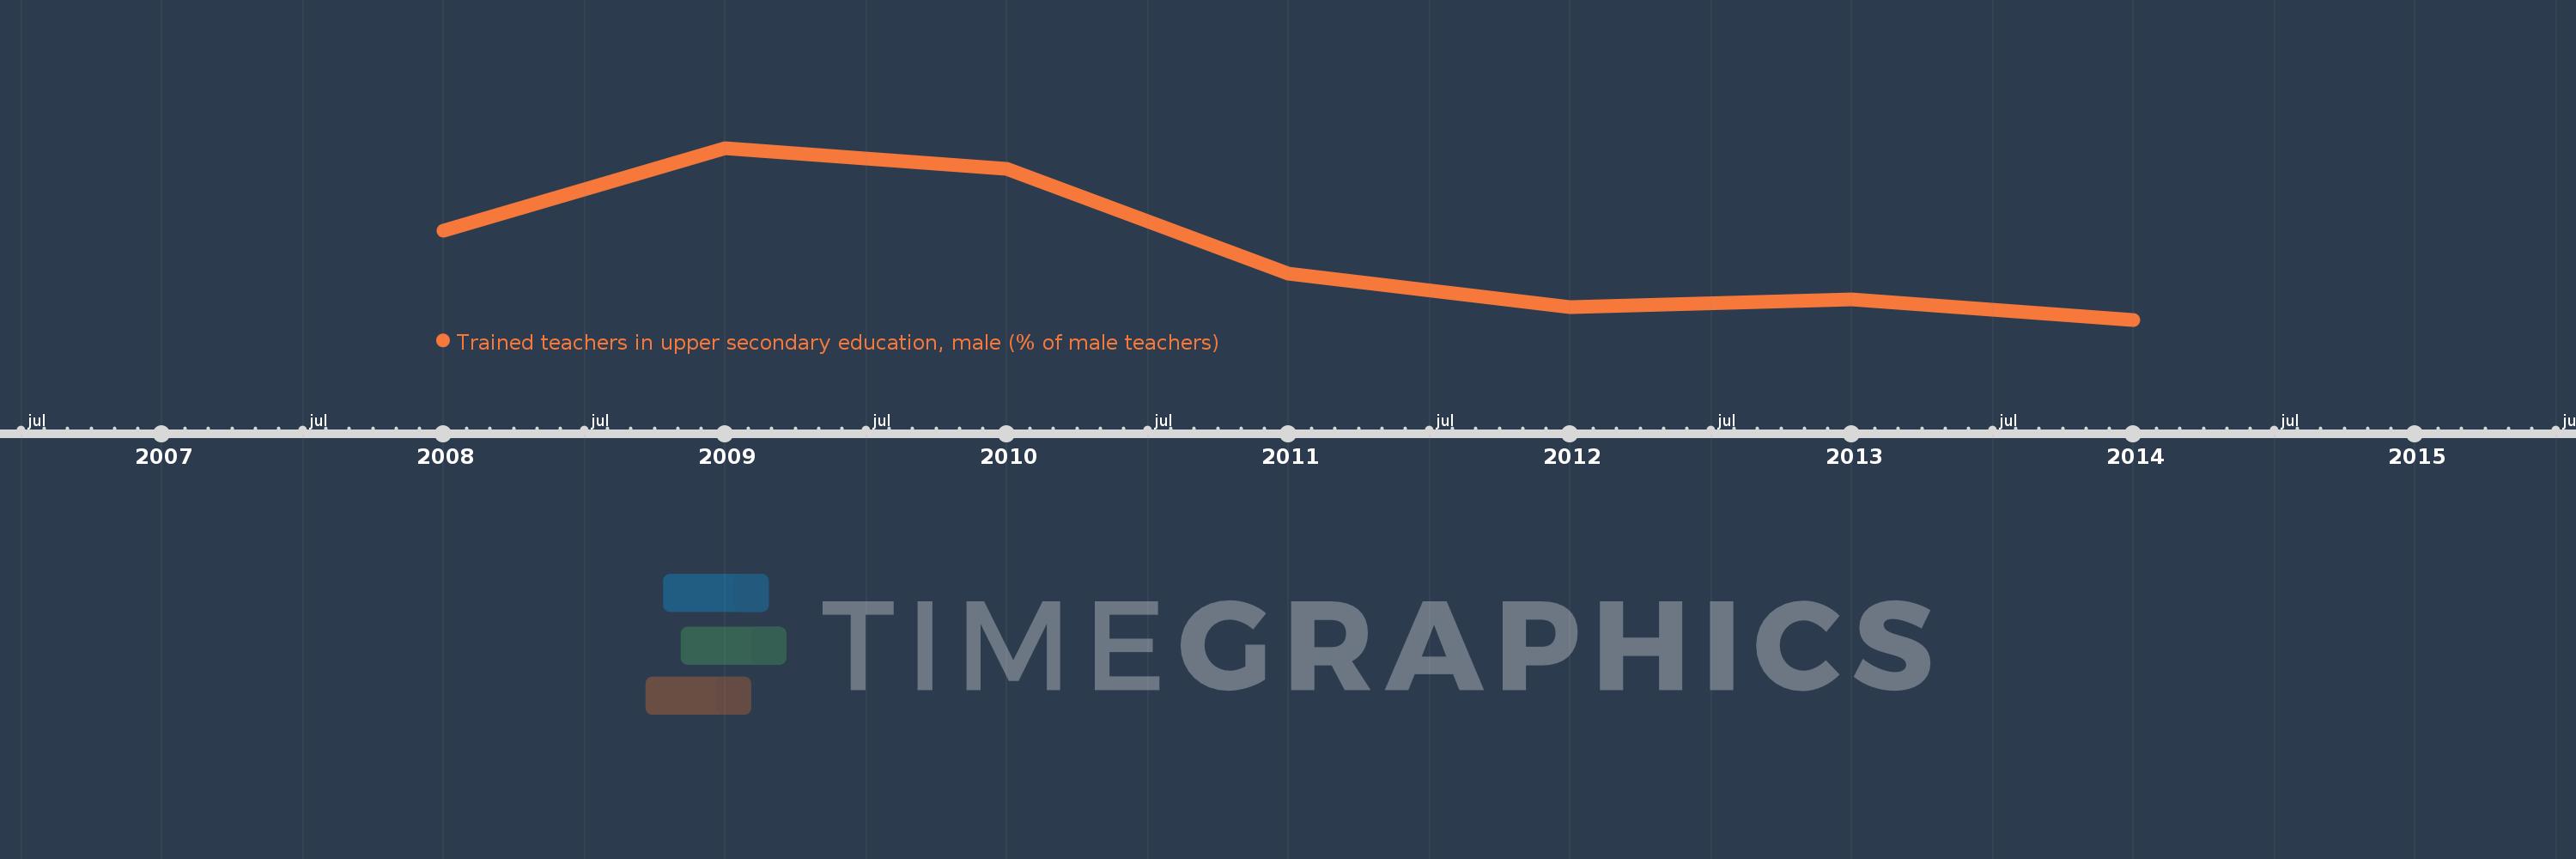
This timeline shows a graph from 2008 to 2014 of Sub-Saharan Africa (IDA & IBRD countries). No data until 2007. Number of actual observations by date: 7.
Source name:
World Development Indicators
Source organization:
United Nations Educational, Scientific, and Cultural Organization (UNESCO) Institute for Statistics.
Categories, topics:
Education
Last updated:
apr 23, 2017
Indicators value changes by year
Meaning:
54.867
Minimum:
47.497
jan 1, 2014
Maximum:
65.559
jan 1, 2009
At the date of observation
Value
Absolute change
Change from the previous value
jan 1, 2008
56.819
+56.819
0.0%
jan 1, 2009
65.559
+8.74
15.38%
jan 1, 2010
63.363
-2.196
-3.35%
jan 1, 2011
52.347
-11.016
-17.39%
jan 1, 2012
48.822
-3.525
-6.73%
jan 1, 2013
49.661
+0.839
1.72%
jan 1, 2014
47.497
-2.164
-4.36%
Ranking of countries by current statistics by years