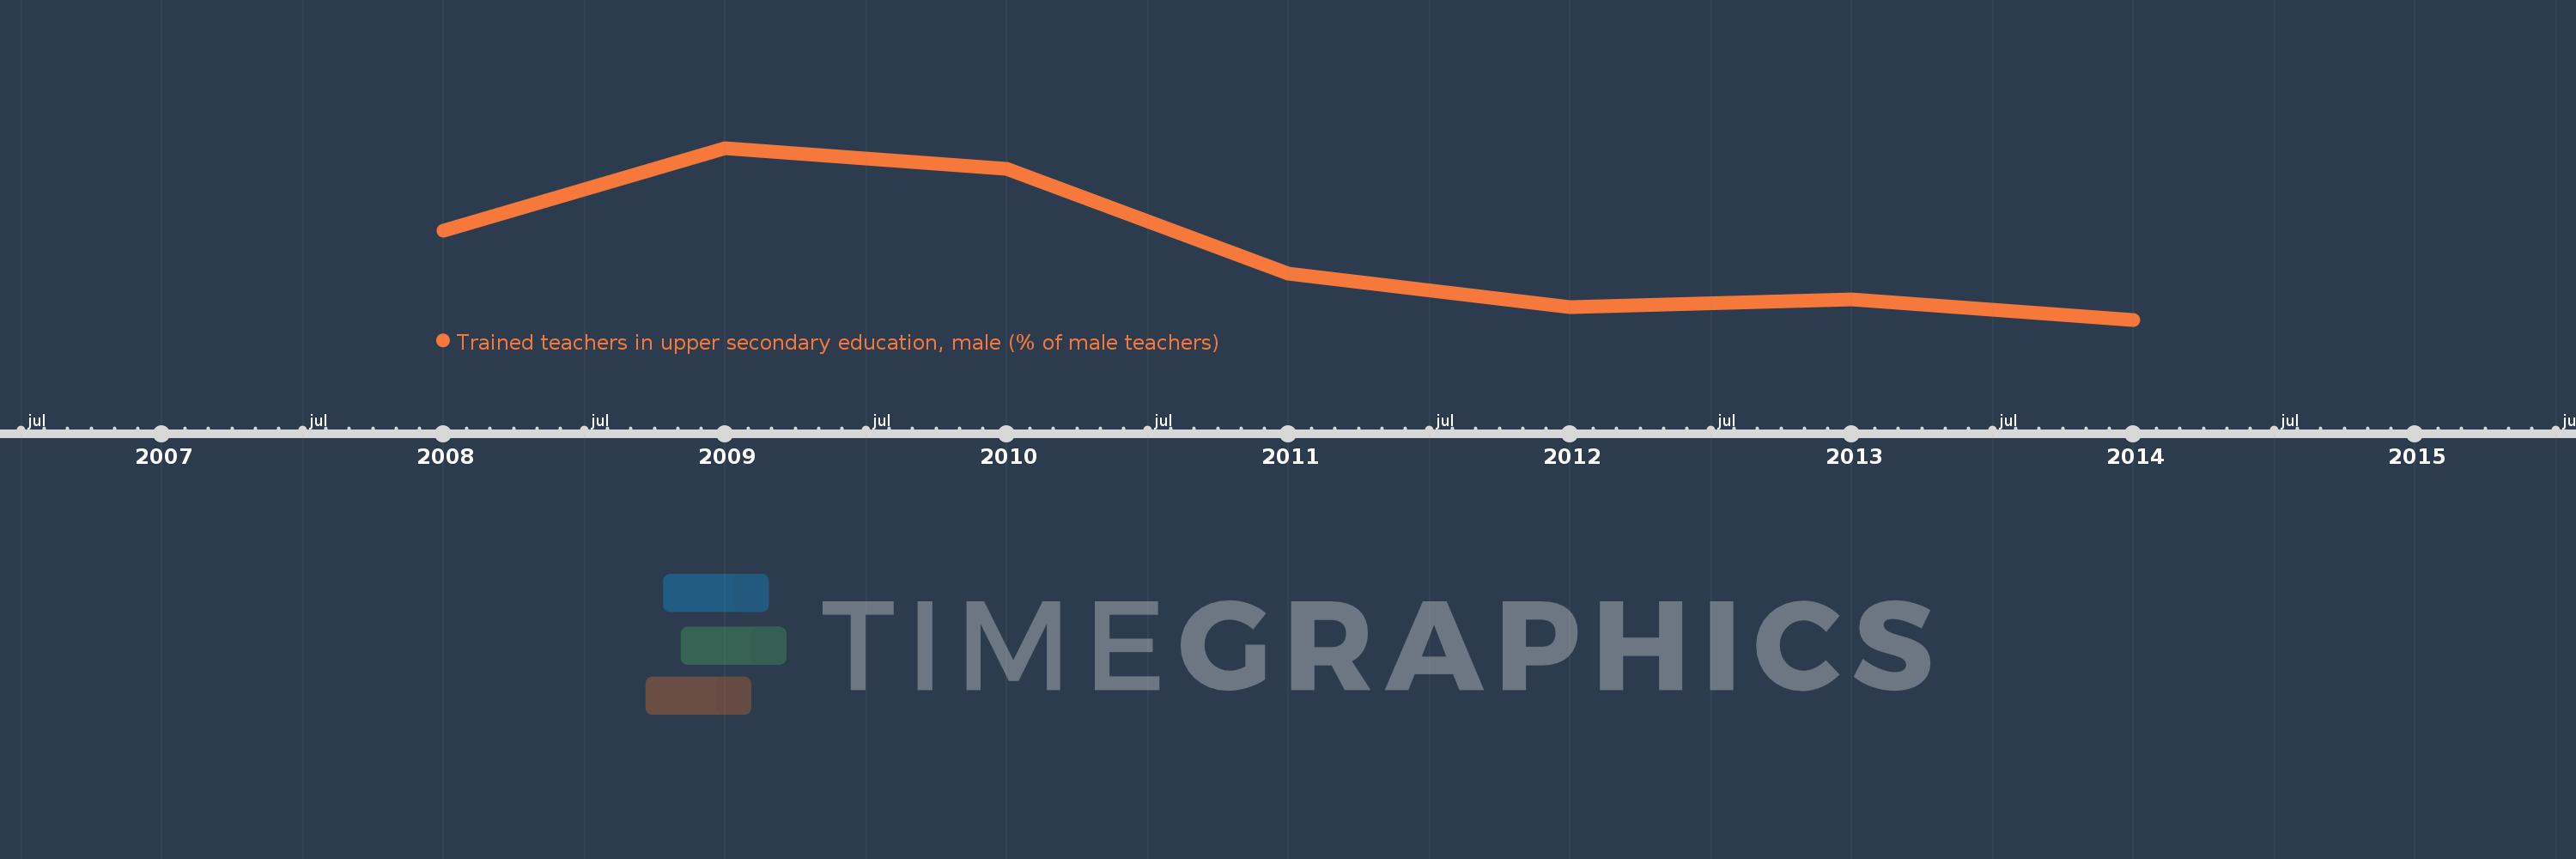
This timeline shows a graph from 2008 to 2014 of Sub-Saharan Africa (excluding high income). No data until 2007. Number of actual observations by date: 7.
Source name:
World Development Indicators
Source organization:
United Nations Educational, Scientific, and Cultural Organization (UNESCO) Institute for Statistics.
Categories, topics:
Education
Last updated:
apr 23, 2017
Indicators value changes by year
Meaning:
54.845
Minimum:
47.477
jan 1, 2014
Maximum:
65.539
jan 1, 2009
At the date of observation
Value
Absolute change
Change from the previous value
jan 1, 2008
56.799
+56.799
0.0%
jan 1, 2009
65.539
+8.74
15.39%
jan 1, 2010
63.338
-2.201
-3.36%
jan 1, 2011
52.323
-11.015
-17.39%
jan 1, 2012
48.8
-3.523
-6.73%
jan 1, 2013
49.641
+0.841
1.72%
jan 1, 2014
47.477
-2.164
-4.36%
Ranking of countries by current statistics by years