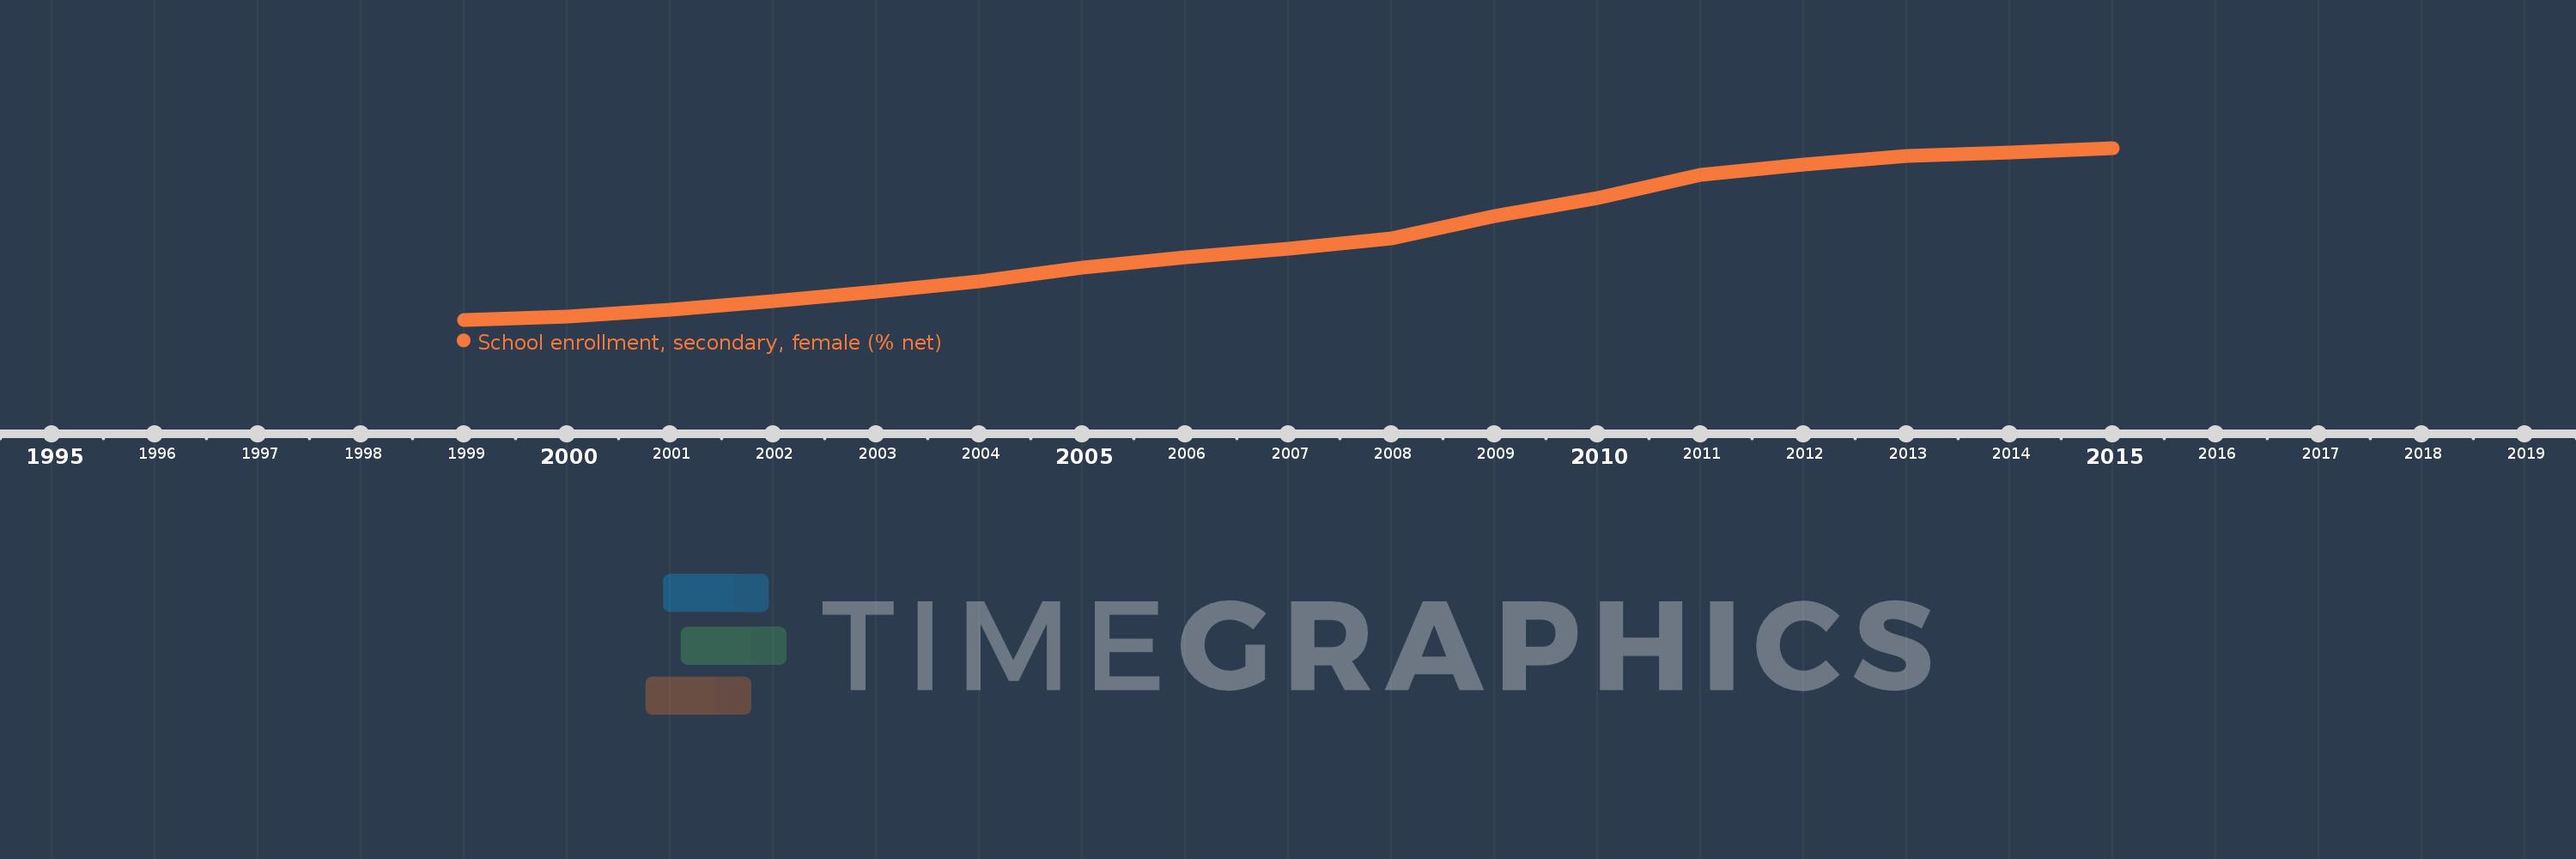
This timeline shows a graph from 1999 to 2015 of Sub-Saharan Africa (IDA & IBRD countries). No data until 1998. Number of actual observations by date: 17.
Source name:
World Development Indicators
Source organization:
United Nations Educational, Scientific, and Cultural Organization (UNESCO) Institute for Statistics.
Categories, topics:
Education, Gender
Last updated:
apr 23, 2017
Indicators value changes by year
Meaning:
24.408
Minimum:
18.111
jan 1, 1999
Maximum:
31.307
jan 1, 2015
At the date of observation
Value
Absolute change
Change from the previous value
jan 1, 1999
18.111
+18.111
0.0%
jan 1, 2000
18.328
+0.217
1.2%
jan 1, 2001
18.867
+0.539
2.94%
jan 1, 2002
19.527
+0.66
3.5%
jan 1, 2003
20.277
+0.75
3.84%
jan 1, 2004
21.087
+0.81
3.99%
jan 1, 2005
22.12
+1.033
4.9%
jan 1, 2006
22.93
+0.81
3.66%
jan 1, 2007
23.574
+0.645
2.81%
jan 1, 2008
24.345
+0.771
3.27%
jan 1, 2009
26.055
+1.71
7.03%
jan 1, 2010
27.467
+1.412
5.42%
jan 1, 2011
29.26
+1.793
6.53%
jan 1, 2012
30.018
+0.758
2.59%
jan 1, 2013
30.688
+0.671
2.23%
jan 1, 2014
30.967
+0.279
0.91%
jan 1, 2015
31.307
+0.34
1.1%
Ranking of countries by current statistics by years