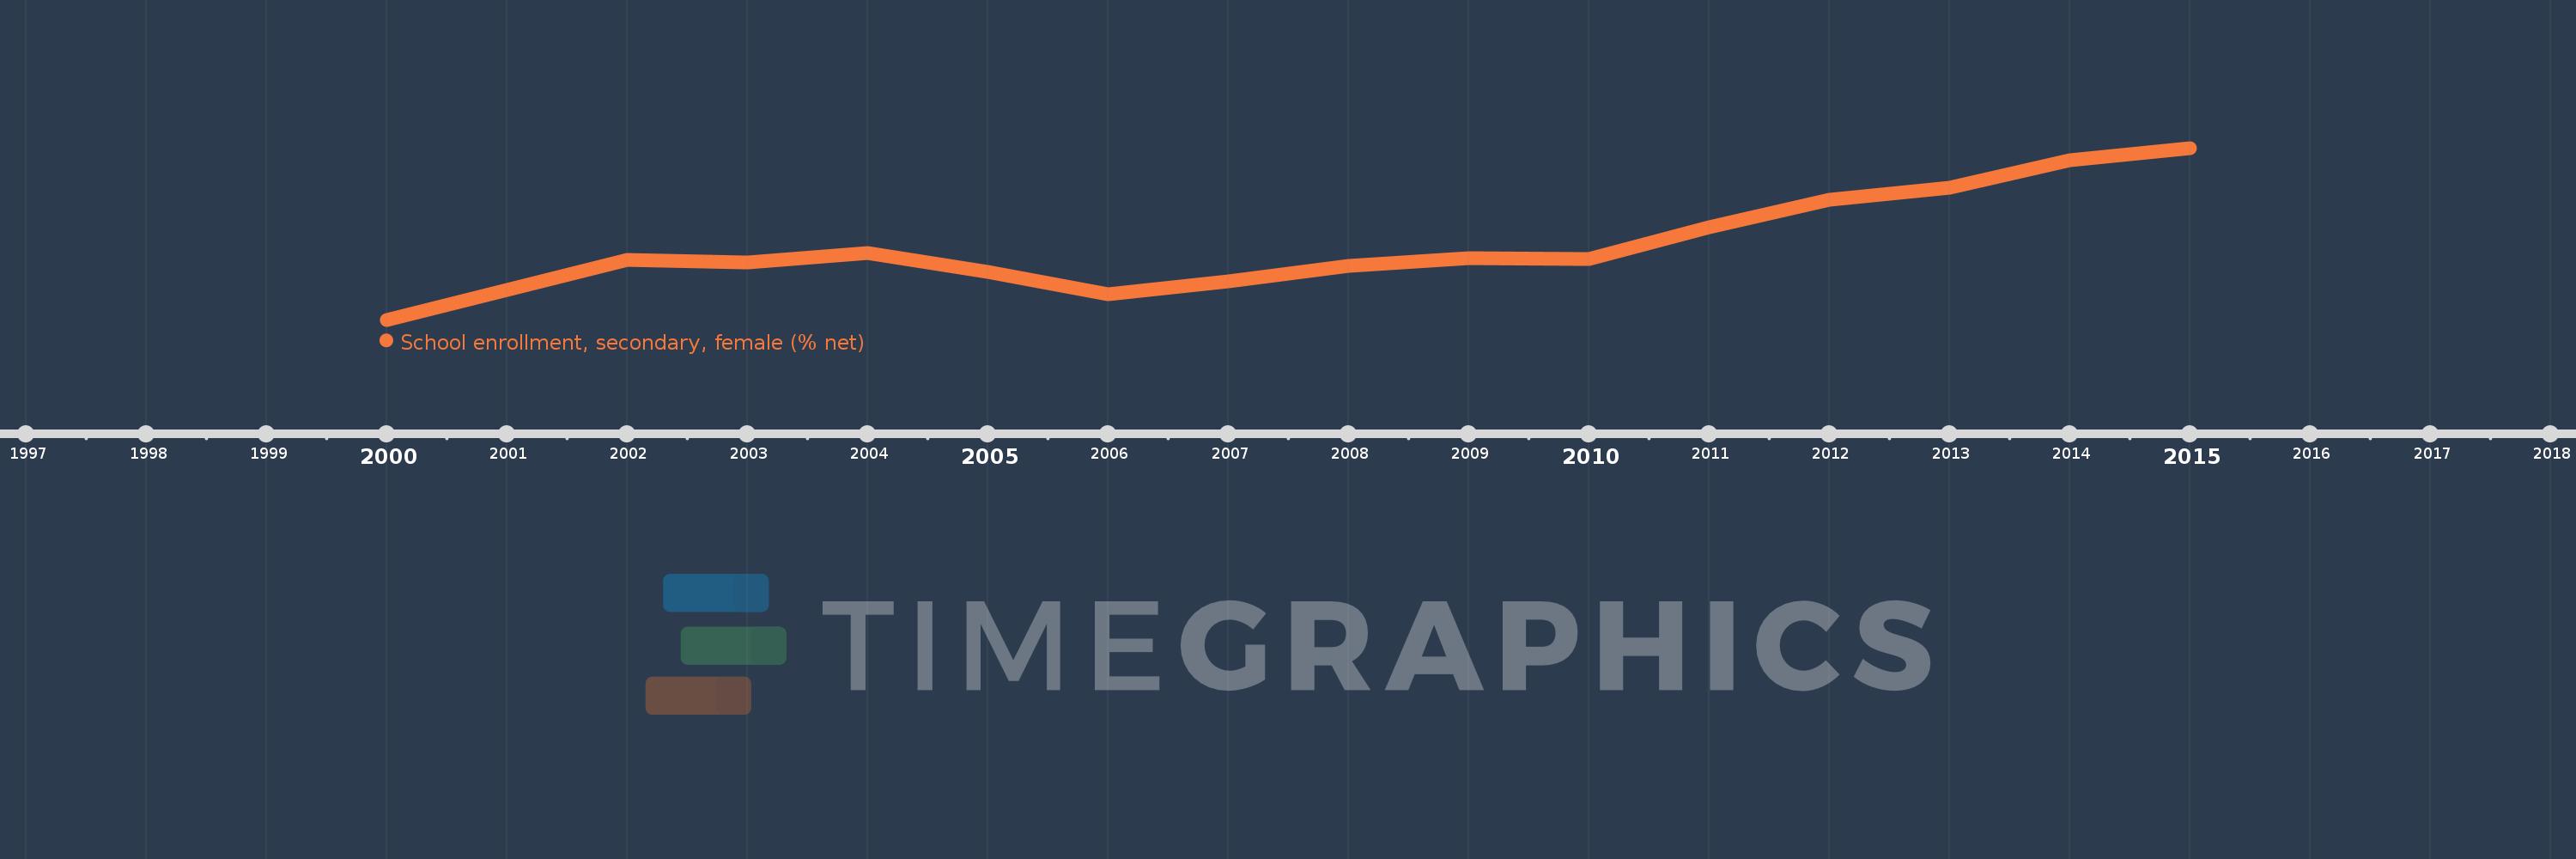
This timeline shows a graph from 2000 to 2015 of Europe & Central Asia (excluding high income). No data until 1999. Number of actual observations by date: 16.
Source name:
World Development Indicators
Source organization:
United Nations Educational, Scientific, and Cultural Organization (UNESCO) Institute for Statistics.
Categories, topics:
Education, Gender
Last updated:
apr 23, 2017
Indicators value changes by year
Meaning:
82.105
Minimum:
78.087
jan 1, 2000
Maximum:
87.477
jan 1, 2015
At the date of observation
Value
Absolute change
Change from the previous value
jan 1, 2000
78.087
+78.087
0.0%
jan 1, 2001
79.728
+1.641
2.1%
jan 1, 2002
81.365
+1.636
2.05%
jan 1, 2003
81.216
-0.149
-0.18%
jan 1, 2004
81.713
+0.498
0.61%
jan 1, 2005
80.713
-1.0
-1.22%
jan 1, 2006
79.459
-1.254
-1.55%
jan 1, 2007
80.168
+0.709
0.89%
jan 1, 2008
81.018
+0.85
1.06%
jan 1, 2009
81.452
+0.434
0.54%
jan 1, 2010
81.406
-0.046
-0.06%
jan 1, 2011
83.164
+1.758
2.16%
jan 1, 2012
84.647
+1.483
1.78%
jan 1, 2013
85.284
+0.636
0.75%
jan 1, 2014
86.783
+1.499
1.76%
jan 1, 2015
87.477
+0.694
0.8%
Ranking of countries by current statistics by years