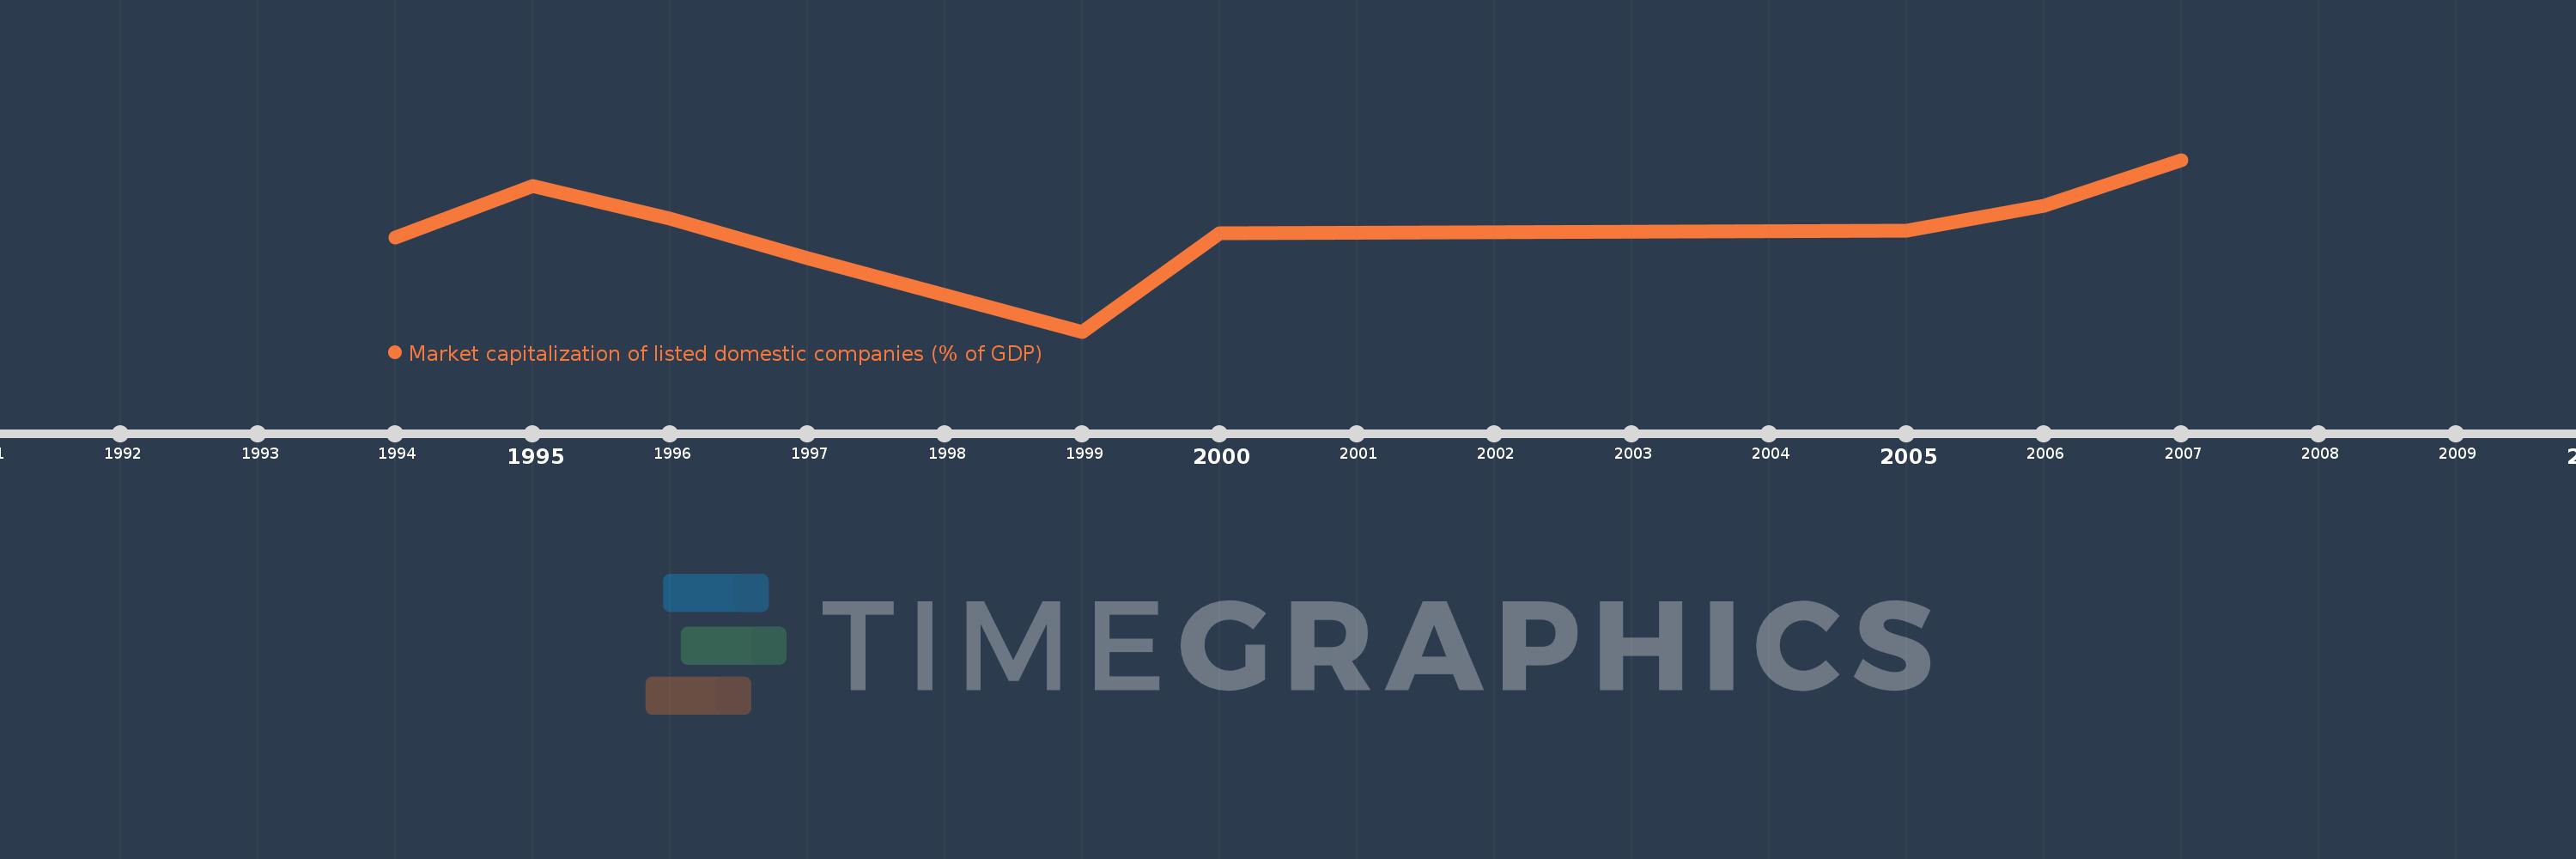
This timeline shows a graph from 1994 to 2007 of Sub-Saharan Africa (IDA & IBRD countries). No data until 1993. Number of actual observations by date: 9.
Source name:
World Development Indicators
Source organization:
World Federation of Exchanges database.
Categories, topics:
Financial Sector
Last updated:
apr 23, 2017
Indicators value changes by year
Meaning:
120.587
Minimum:
82.507
jan 1, 1999
Maximum:
146.263
jan 1, 2007
At the date of observation
Value
Absolute change
Change from the previous value
jan 1, 1994
117.406
+117.406
0.0%
jan 1, 1995
136.655
+19.249
16.4%
jan 1, 1996
124.544
-12.112
-8.86%
jan 1, 1997
109.859
-14.685
-11.79%
jan 1, 1999
82.507
-27.352
-24.9%
jan 1, 2000
119.074
+36.567
44.32%
jan 1, 2005
119.883
+0.809
0.68%
jan 1, 2006
129.092
+9.209
7.68%
jan 1, 2007
146.263
+17.17
13.3%
Ranking of countries by current statistics by years