Download This statistics in other country:
Timeline:
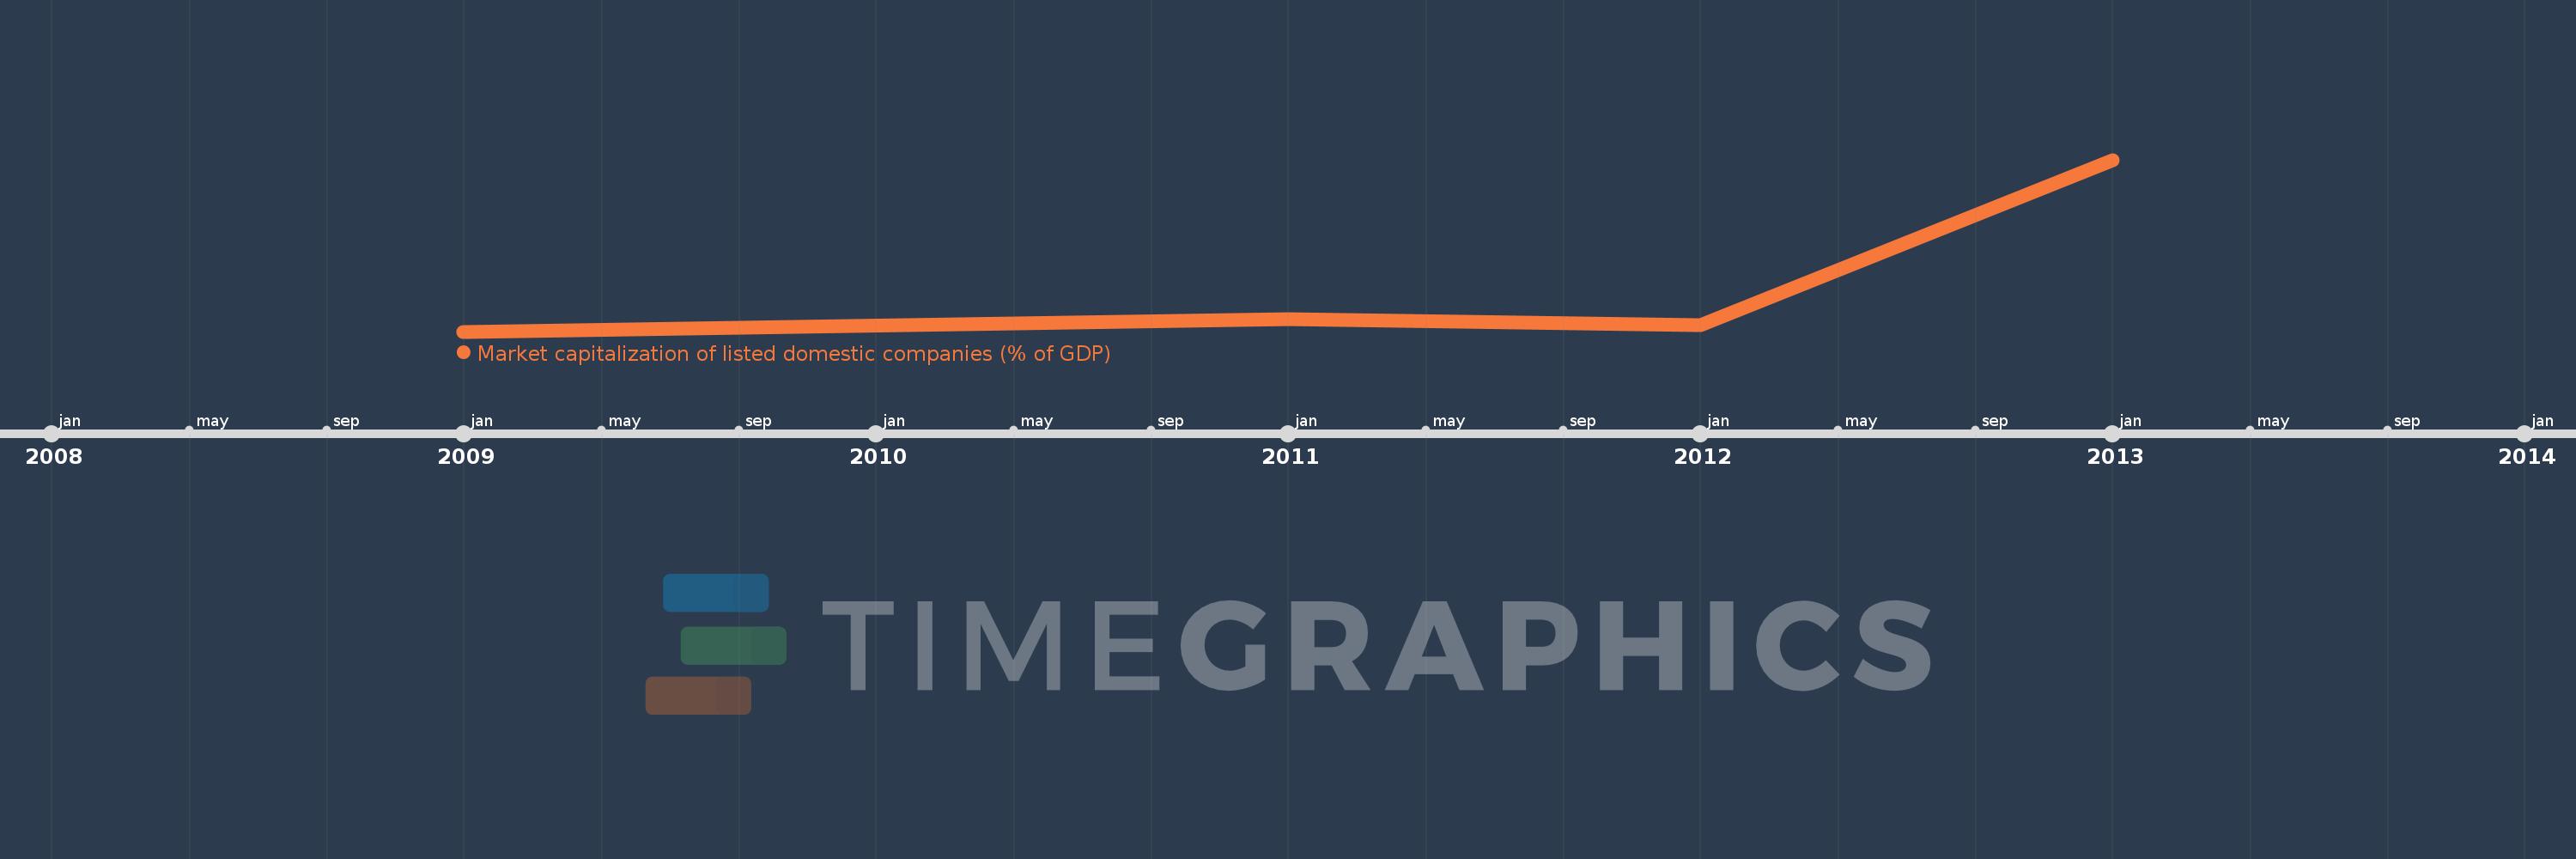
This timeline shows a graph from 2009 to 2013 of Montenegro. No data until 2008. Number of actual observations by date: 4.
Source name:
World Development Indicators
Source organization:
World Federation of Exchanges database.
Categories, topics:
Financial Sector
Last updated:
apr 23, 2017
Indicators value changes by year
Minimum:
76.733
jan 1, 2009
Maximum:
92.648
jan 1, 2013
At the date of observation
Value
Absolute change
Change from the previous value
jan 1, 2009
76.733
+76.733
0.0%
jan 1, 2011
77.864
+1.13
1.47%
jan 1, 2012
77.32
-0.544
-0.7%
jan 1, 2013
92.648
+15.328
19.82%
Ranking of countries by current statistics by years