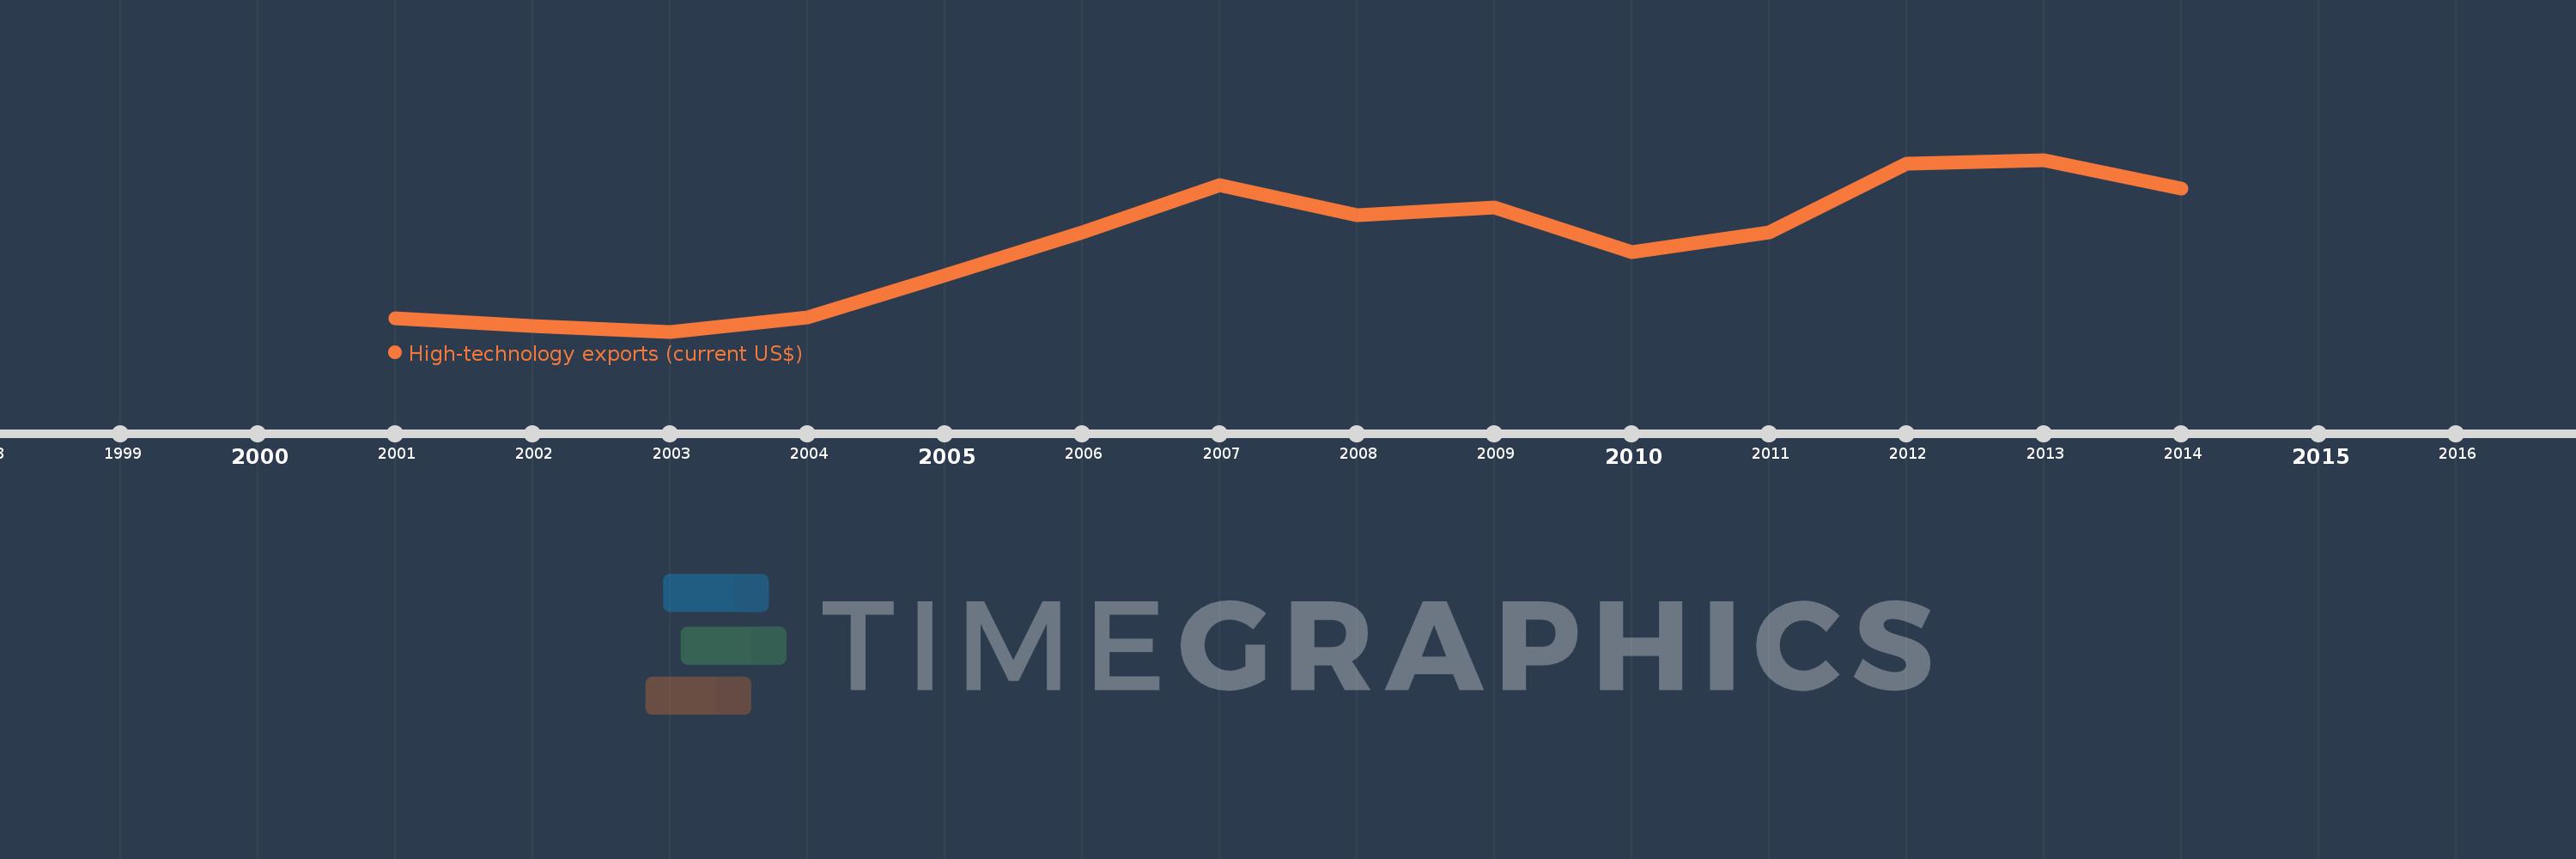
This timeline shows a graph from 2001 to 2014 of Sub-Saharan Africa (IDA & IBRD countries). No data until 2000. Number of actual observations by date: 14.
Source name:
World Development Indicators
Source organization:
United Nations, Comtrade database.
Categories, topics:
Private Sector, Science & Technology, Trade
Last updated:
apr 23, 2017
Indicators value changes by year
Meaning:
2.132 bln
Minimum:
925.68 mln
jan 1, 2003
Maximum:
3.269 bln
jan 1, 2013
At the date of observation
Value
Absolute change
Change from the previous value
jan 1, 2001
1.105 bln
+1.105 bln
0.0%
jan 1, 2002
1.006 bln
-99.39 mln
-8.99%
jan 1, 2003
925.68 mln
-80.412 mln
-7.99%
jan 1, 2004
1.116 bln
+190.331 mln
20.56%
jan 1, 2005
1.69 bln
+573.685 mln
51.4%
jan 1, 2006
2.276 bln
+586.67 mln
34.72%
jan 1, 2007
2.928 bln
+651.197 mln
28.61%
jan 1, 2008
2.515 bln
-412.396 mln
-14.09%
jan 1, 2009
2.624 bln
+109.244 mln
4.34%
jan 1, 2010
2.01 bln
-614.771 mln
-23.43%
jan 1, 2011
2.285 bln
+275.267 mln
13.7%
jan 1, 2012
3.221 bln
+936.542 mln
40.99%
jan 1, 2013
3.269 bln
+47.848 mln
1.49%
jan 1, 2014
2.879 bln
-390.06 mln
-11.93%
Ranking of countries by current statistics by years