33
/
AIzaSyB4mHJ5NPEv-XzF7P6NDYXjlkCWaeKw5bc
November 30, 2025
266932
Trinidad and Tobago
TTO
true
2
1
High-technology exports (current US$)
2011,2010,2009,2008,2007,2006,2005,2004,2003,2002,2001,2000,1999,1998,1997,1996,1995,1994,1993,1992
Create a timeline
Public Timelines
For education
For educational institutions
For teachers
For students
Cabinet
For educational institutions
For teachers
For students
Open cabinet
FAQ
Close
Create a timeline
Public timelines
FAQ
About & Feedback
Terms
Privacy
FAQ
Support 24/7
Cabinet
Get premium
Donate
Download
Global statistics library
→
Trinidad and Tobago
→
High-technology exports (current US$)
This statistics in other country:
Albania
Algeria
Andorra
Antigua and Barbuda
Arab World
Argentina
Armenia
Aruba
Australia
Austria
Azerbaijan
Bahamas, The
Bahrain
Bangladesh
Barbados
Belarus
Belgium
Belize
Benin
Bermuda
Bhutan
Bolivia
Bosnia and Herzegovina
Botswana
Brazil
Brunei Darussalam
Bulgaria
Burkina Faso
Burundi
Cabo Verde
Cambodia
Cameroon
Canada
Caribbean small states
Central African Republic
Central Europe and the Baltics
Chile
China
Colombia
Comoros
Congo, Rep.
Costa Rica
Cote d'Ivoire
Croatia
Cuba
Cyprus
Czech Republic
Denmark
Djibouti
Dominica
Dominican Republic
Early-demographic dividend
East Asia & Pacific
Ecuador
Egypt, Arab Rep.
El Salvador
Eritrea
Estonia
Ethiopia
Euro area
Europe & Central Asia
Europe & Central Asia (excluding high income)
Europe & Central Asia (IDA & IBRD countries)
European Union
Faroe Islands
Fiji
Finland
France
French Polynesia
Gabon
Gambia, The
Georgia
Germany
Ghana
Greece
Greenland
Grenada
Guatemala
Guinea
Guinea-Bissau
Guyana
Haiti
Heavily indebted poor countries (HIPC)
High income
Honduras
Hong Kong SAR, China
Hungary
IBRD only
Iceland
IDA & IBRD total
IDA blend
IDA only
IDA total
India
Indonesia
Iran, Islamic Rep.
Iraq
Ireland
Israel
Italy
Jamaica
Japan
Jordan
Kazakhstan
Kenya
Kiribati
Korea, Rep.
Kuwait
Kyrgyz Republic
Late-demographic dividend
Latin America & Caribbean
Latin America & Caribbean (excluding high income)
Latin America & the Caribbean (IDA & IBRD countries)
Latvia
Lebanon
Lesotho
Lithuania
Low & middle income
Low income
Lower middle income
Luxembourg
Macao SAR, China
Macedonia, FYR
Madagascar
Malawi
Malaysia
Maldives
Mali
Malta
Mauritius
Mexico
Middle East & North Africa
Middle East & North Africa (excluding high income)
Middle East & North Africa (IDA & IBRD countries)
Middle income
Moldova
Mongolia
Montenegro
Morocco
Mozambique
Myanmar
Namibia
Nepal
Netherlands
New Caledonia
New Zealand
Nicaragua
Niger
Nigeria
North America
Norway
OECD members
Oman
Other small states
Pakistan
Palau
Panama
Papua New Guinea
Paraguay
Peru
Philippines
Poland
Portugal
Post-demographic dividend
Qatar
Romania
Russian Federation
Rwanda
Samoa
Sao Tome and Principe
Saudi Arabia
Senegal
Serbia
Seychelles
Sierra Leone
Singapore
Slovak Republic
Slovenia
Small states
Solomon Islands
South Africa
South Asia
South Asia (IDA & IBRD)
South Sudan
Spain
Sri Lanka
St. Kitts and Nevis
St. Lucia
St. Vincent and the Grenadines
Sub-Saharan Africa
Sub-Saharan Africa (excluding high income)
Sub-Saharan Africa (IDA & IBRD countries)
Sudan
Suriname
Swaziland
Sweden
Switzerland
Syrian Arab Republic
Tajikistan
Tanzania
Thailand
Timor-Leste
Togo
Tonga
Trinidad and Tobago
Tunisia
Turkey
Turkmenistan
Turks and Caicos Islands
Tuvalu
Uganda
Ukraine
United Arab Emirates
United Kingdom
United States
Upper middle income
Uruguay
Vanuatu
Venezuela, RB
Vietnam
West Bank and Gaza
World
Yemen, Rep.
Zambia
Zimbabwe
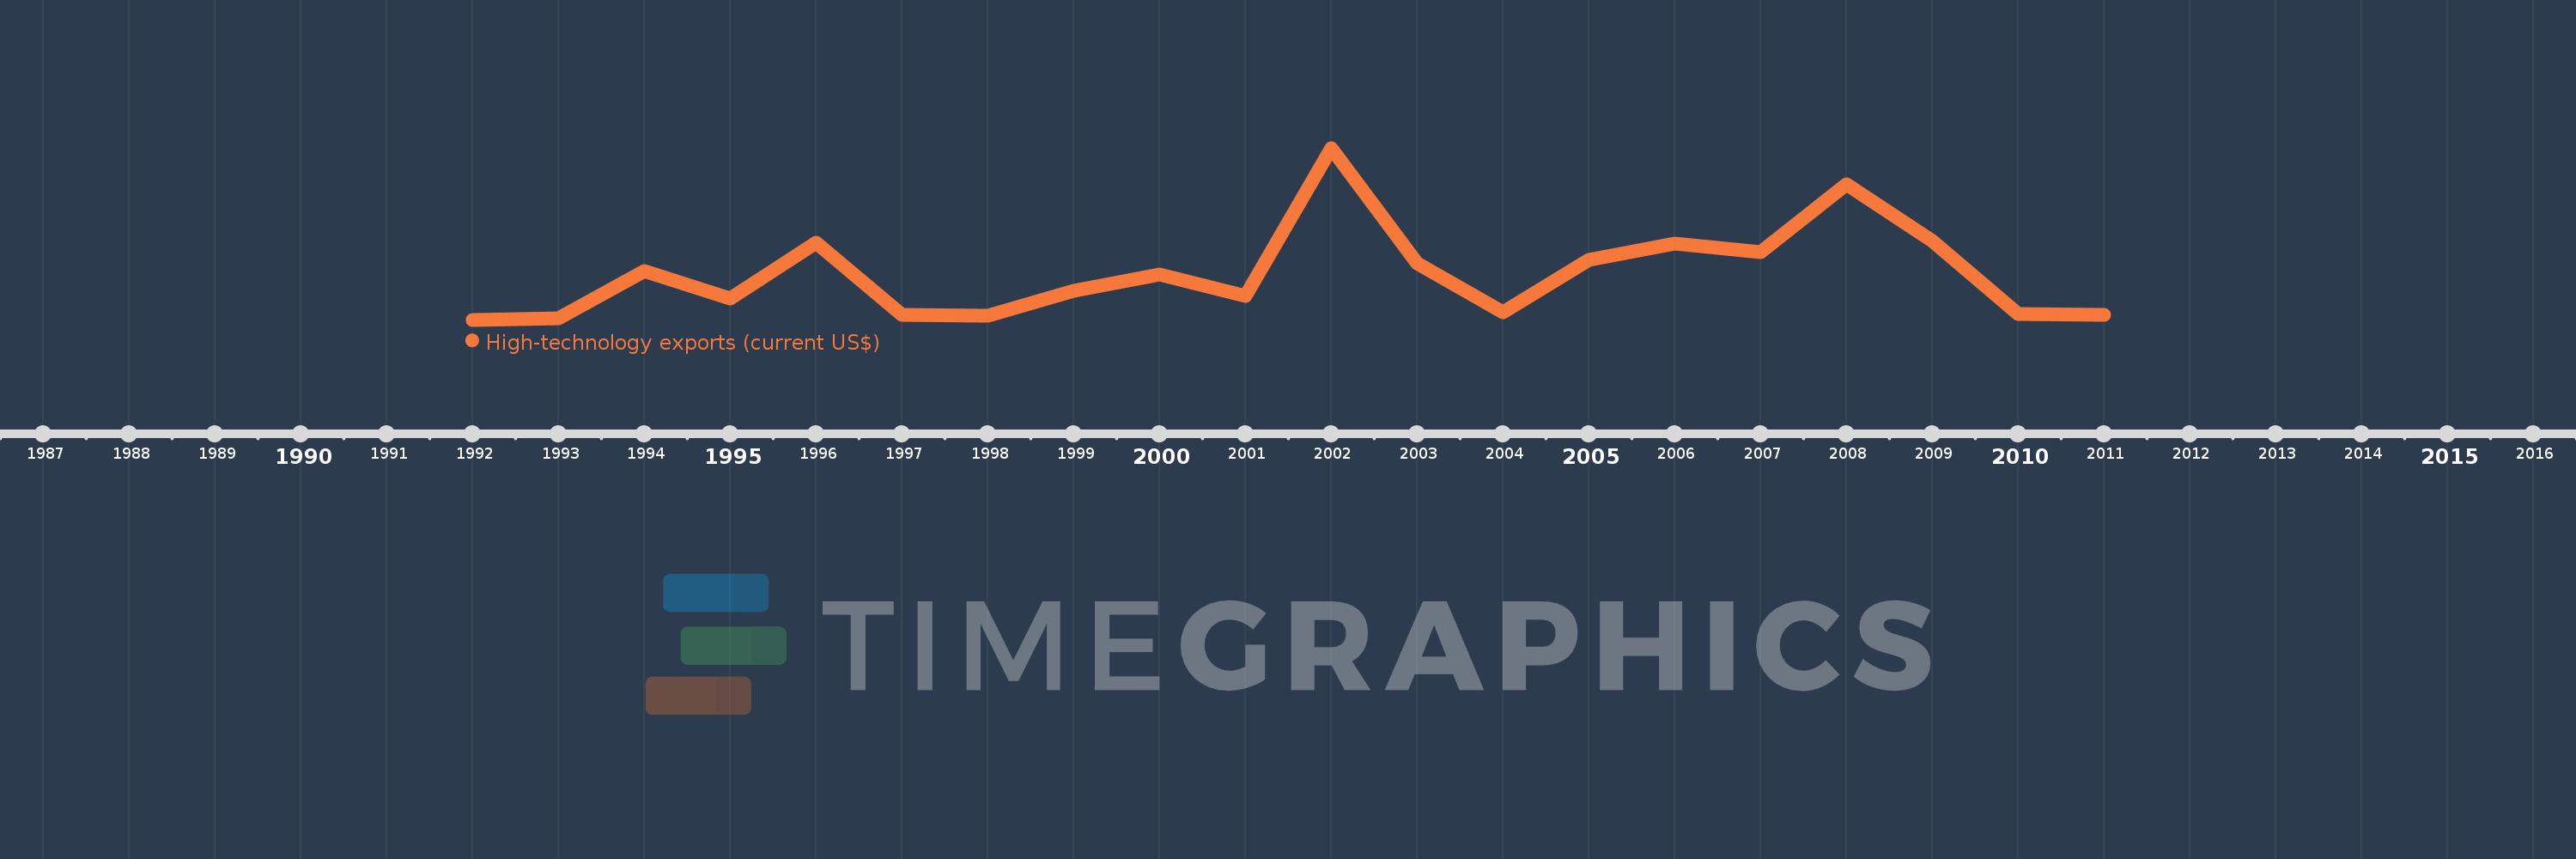
Timeline:
This timeline shows a graph from
1992
to
2011
of Trinidad and Tobago. No data until
1991
. Number of actual observations by date:
20
.
Source name:
World Development Indicators
Source organization:
United Nations, Comtrade database.
Categories, topics:
Private Sector, Science & Technology, Trade
Last updated:
apr 23, 2017
Indicators value changes by year
Meaning:
20.801 mln
Minimum:
799.6K
jan 1, 1992
Maximum:
75.392 mln
jan 1, 2002
At the date of observation
Value
Absolute change
Change from the previous value
jan 1, 1992
799.6K
+799.6K
0.0%
jan 1, 1993
1.317 mln
+517.021K
64.66%
jan 1, 1994
21.936 mln
+20.619 mln
1.57K%
jan 1, 1995
10.026 mln
-11.91 mln
-54.3%
jan 1, 1996
34.178 mln
+24.152 mln
240.9%
jan 1, 1997
2.946 mln
-31.232 mln
-91.38%
jan 1, 1998
2.461 mln
-484.555K
-16.45%
jan 1, 1999
13.508 mln
+11.047 mln
448.82%
jan 1, 2000
20.565 mln
+7.056 mln
52.24%
jan 1, 2001
11.251 mln
-9.314 mln
-45.29%
jan 1, 2002
75.392 mln
+64.141 mln
570.09%
jan 1, 2003
25.461 mln
-49.931 mln
-66.23%
jan 1, 2004
4.224 mln
-21.237 mln
-83.41%
jan 1, 2005
26.926 mln
+22.701 mln
537.43%
jan 1, 2006
33.927 mln
+7.001 mln
26.0%
jan 1, 2007
30.165 mln
-3.762 mln
-11.09%
jan 1, 2008
59.579 mln
+29.414 mln
97.51%
jan 1, 2009
34.999 mln
-24.58 mln
-41.26%
jan 1, 2010
3.253 mln
-31.747 mln
-90.71%
jan 1, 2011
3.103 mln
-149.905K
-4.61%
Ranking of countries by current statistics by years
About & Feedback
Terms
Privacy
FAQ
Support 24/7
Cabinet
Get premium
Donate
The service accepts bank transfer (ACH, Wire) or cards (Visa, MasterCard, etc). Processed by Stripe.
Secured with SSL