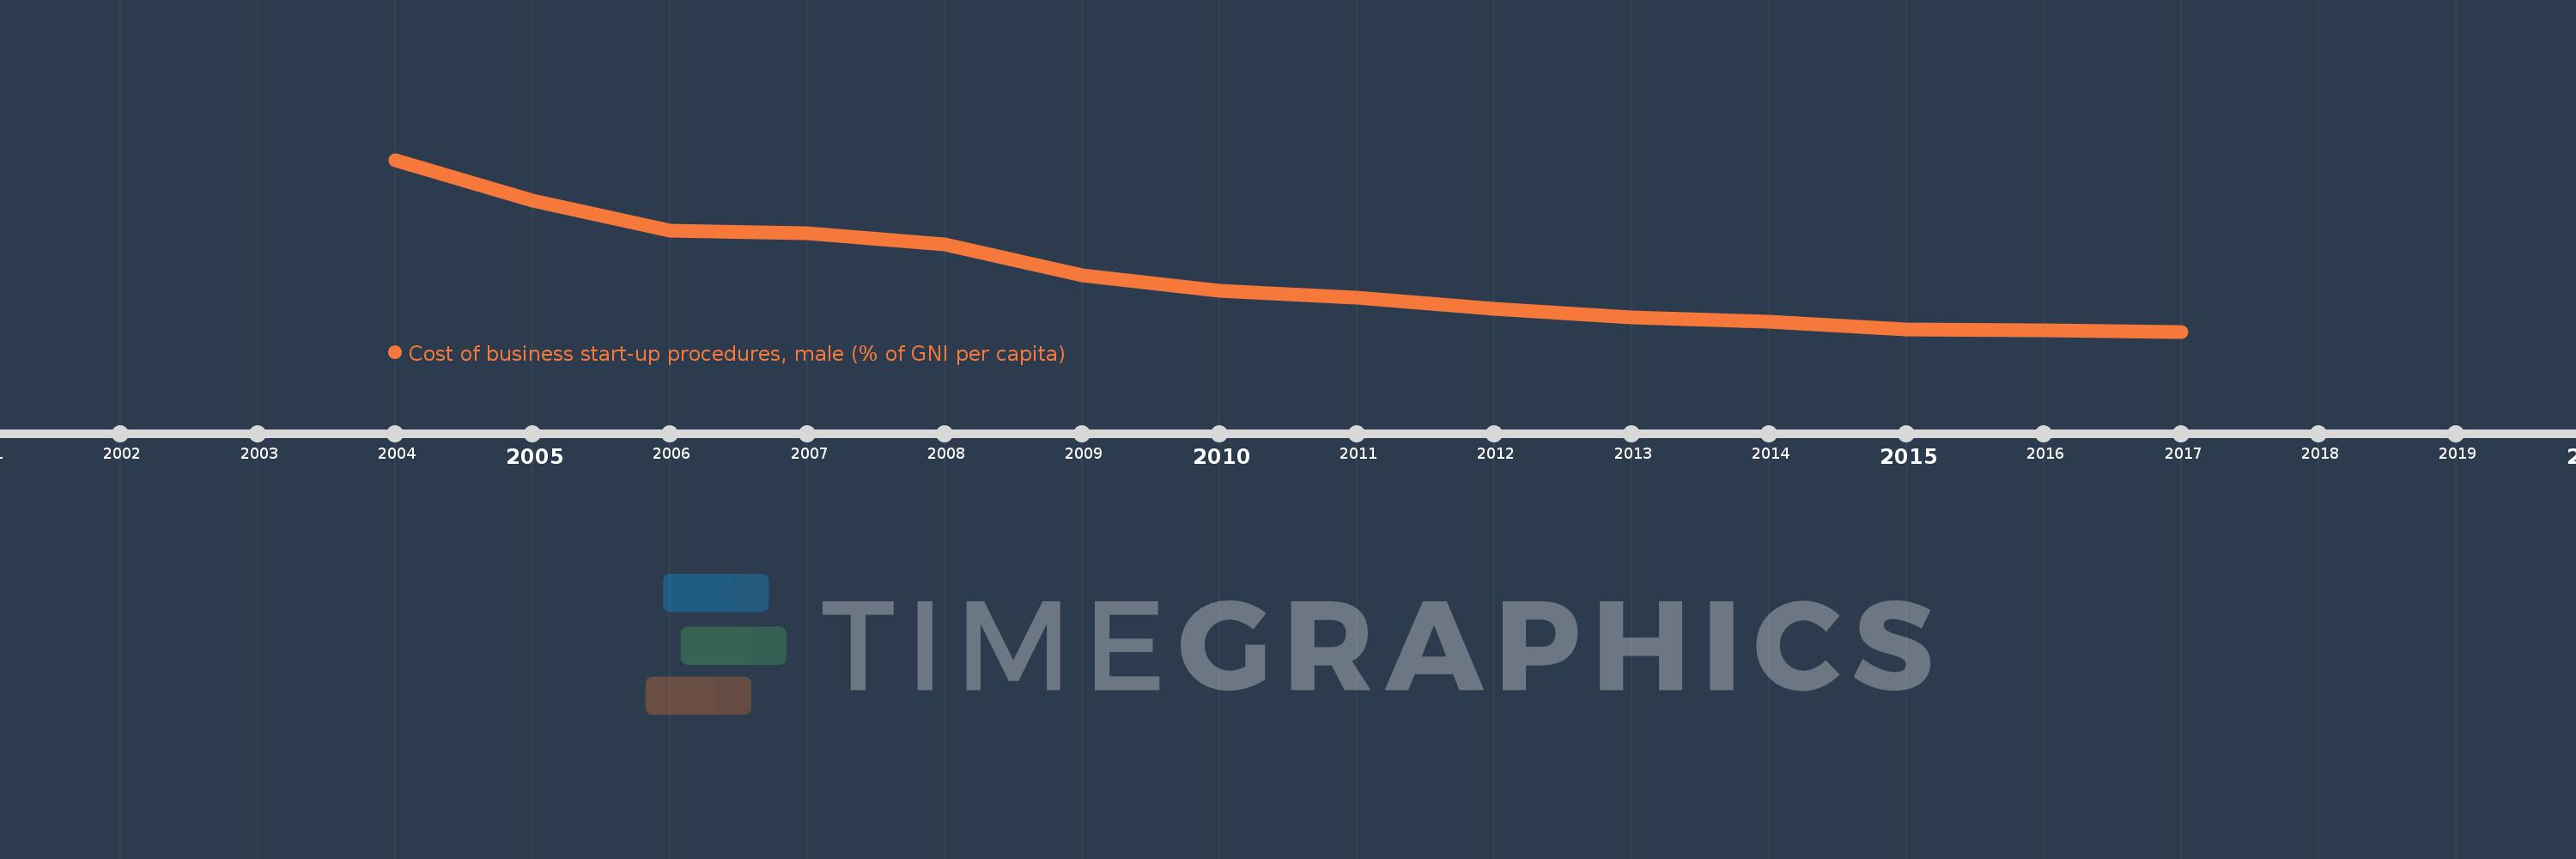
This timeline shows a graph from 2004 to 2017 of Sub-Saharan Africa (IDA & IBRD countries). No data until 2003. Number of actual observations by date: 14.
Source name:
World Development Indicators
Source organization:
World Bank, Doing Business project (http://www.doingbusiness.org/).
Categories, topics:
Private Sector
Last updated:
apr 23, 2017
Indicators value changes by year
Meaning:
132.746
Minimum:
54.044
jan 1, 2017
Maximum:
300.061
jan 1, 2004
At the date of observation
Value
Absolute change
Change from the previous value
jan 1, 2004
300.061
+300.061
0.0%
jan 1, 2005
241.7
-58.361
-19.45%
jan 1, 2006
198.633
-43.067
-17.82%
jan 1, 2007
194.746
-3.888
-1.96%
jan 1, 2008
178.476
-16.27
-8.35%
jan 1, 2009
134.504
-43.972
-24.64%
jan 1, 2010
111.9
-22.604
-16.81%
jan 1, 2011
102.687
-9.213
-8.23%
jan 1, 2012
86.687
-16.0
-15.58%
jan 1, 2013
73.957
-12.73
-14.68%
jan 1, 2014
68.513
-5.445
-7.36%
jan 1, 2015
56.789
-11.723
-17.11%
jan 1, 2016
55.748
-1.041
-1.83%
jan 1, 2017
54.044
-1.704
-3.06%
Ranking of countries by current statistics by years